
Identity
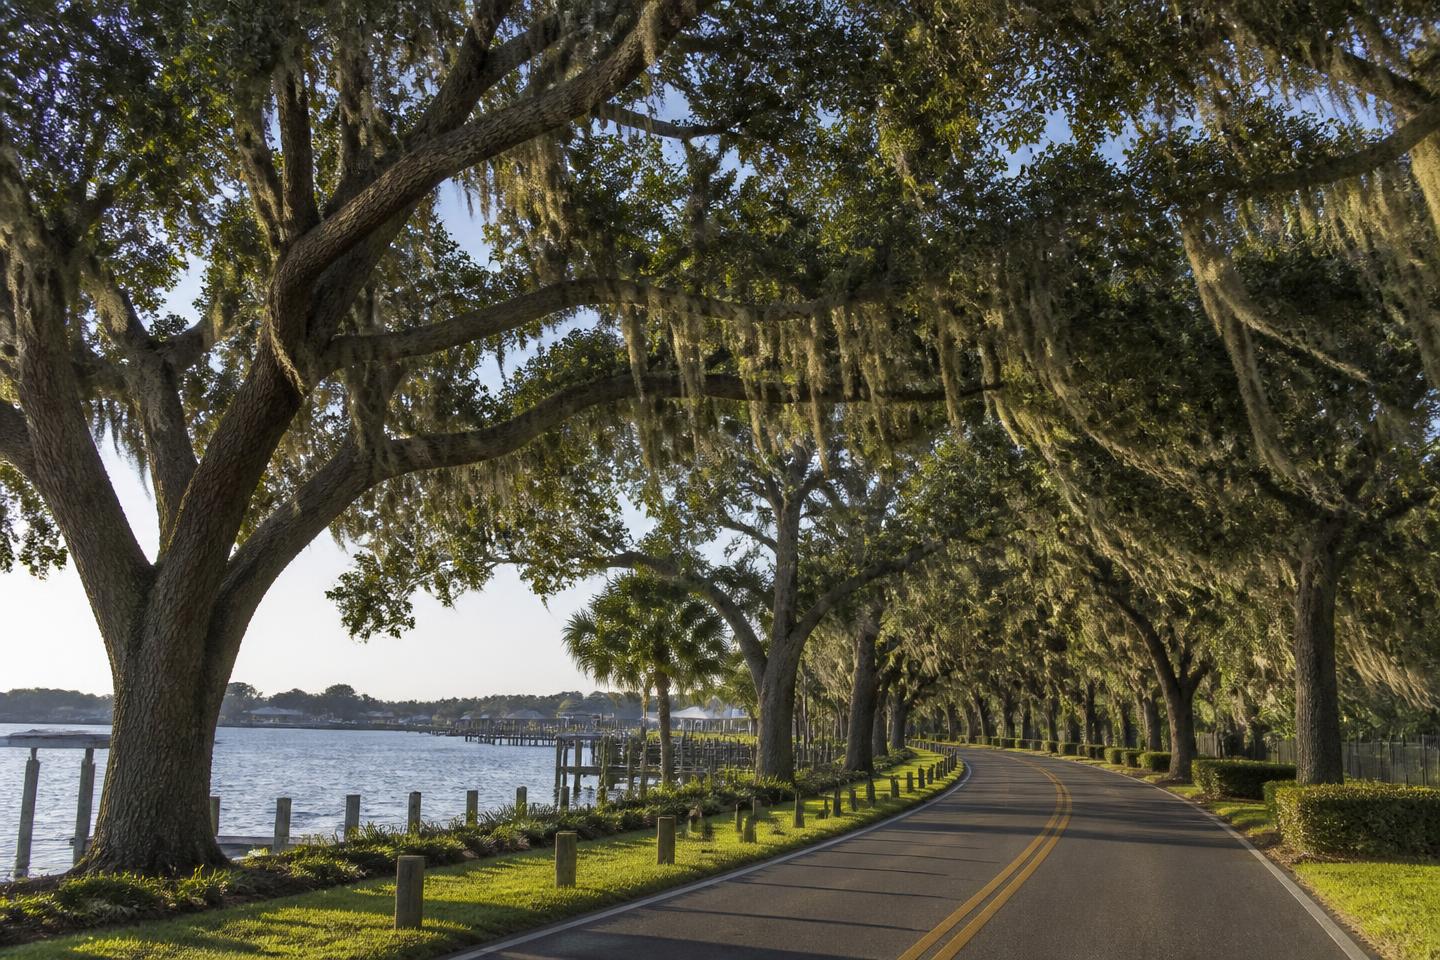
Ormond Beach has an older, calmer character than its neighbour: historic estates along the Halifax River, protected scenic roads and a beachside that is mostly residential rather than commercial.
Volusia County
Greater OrlandoFlorida
A residential coastal city north of Daytona, with oak-canopied riverfront streets, the Loop scenic drive and a quieter beachfront.
Talk to DaniOrmond Beach has an older, calmer character than its neighbour: historic estates along the Halifax River, protected scenic roads and a beachside that is mostly residential rather than commercial.
East Volusia County on the Atlantic and the Halifax River, north of Daytona Beach on A1A and US-1.
In practice, here is the rhythm you will find: beach and river recreation, with everyday retail on Granada Boulevard.
concentrated west of I-95, where land remains available.
Plan on this for getting around: car-based; I-95, US-1 and A1A serve the city.
The area
Wide hard-sand beaches north of a bridge over the Halifax River.
Real life here
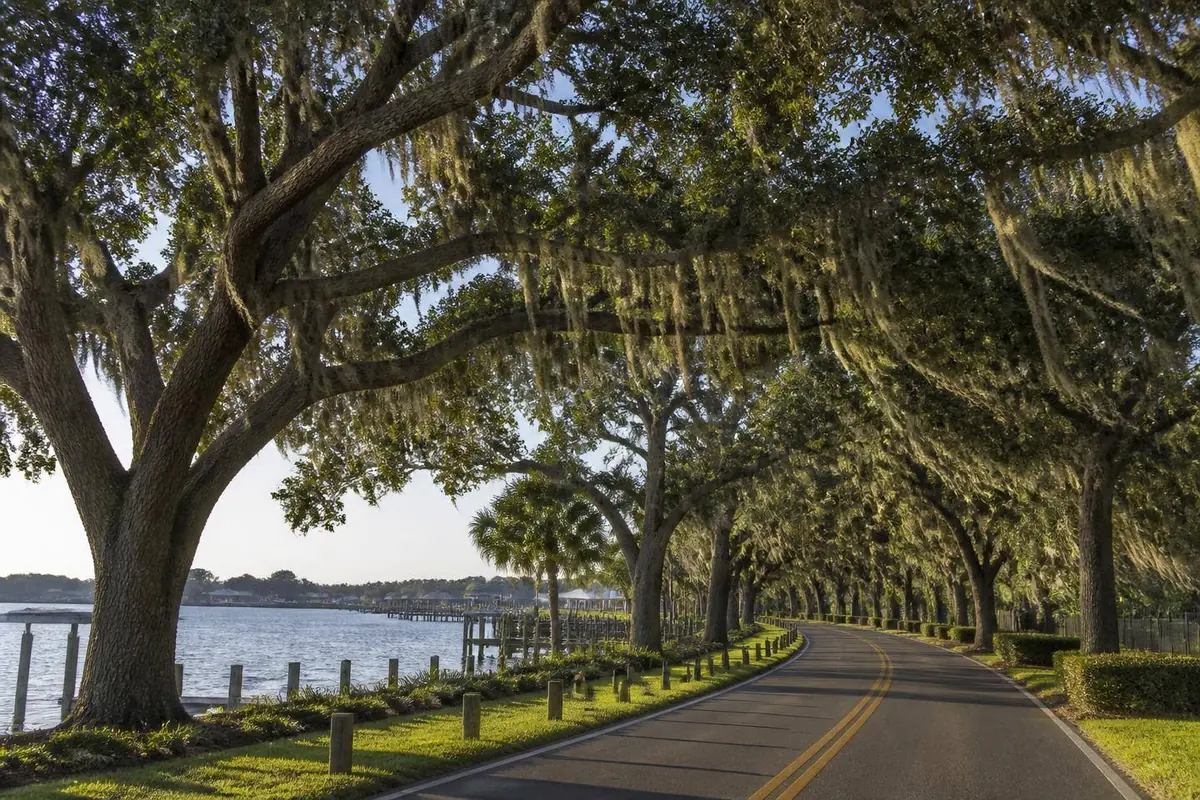
The pace is quieter than in neighboring Daytona: mornings often start with a drive or bike ride along the Loop under oak canopy, errands run along Granada Boulevard, and the beachside stays largely residential rather than commercial. Evenings tend to be spent along the Halifax River or on a mostly uncrowded stretch of beach.
Granada Boulevard carries most of the everyday restaurants and cafés, with a smaller, calmer selection than Daytona's beachfront strip. Larger supermarkets and chain dining sit along US-1 and near I-95.
Groceries, pharmacies and medical offices are available along Granada Boulevard and Nova Road, with hospitals a short drive south in Daytona Beach.
Hurricane season runs June through November; riverfront and beachside properties both carry flood and wind considerations, and older homes near the river often need tree and structural inspection ahead of storm season. Visitor volume rises in the warmer months but stays lighter here than in Daytona proper.
Around here
Real institutions inside this area's radius, ordered by distance. No ratings: assignment depends on the exact address, and a star average does not measure a school.
Source: Google Places. Names, addresses, photos and ratings are published by Google and can change.
Around here
Real addresses nearby, with public Google ratings where they exist.
Turkish restaurant
488 S Yonge St, Ormond Beach, FL 32174, USA
Restaurant
600 S Yonge St #16B, Ormond Beach, FL 32174, USA
Cocktails at an ornamental bar & Southern comfort classics in a historic building.
43 W Granada Blvd, Ormond Beach, FL 32174, USA
Sprawling restaurant with a riverfront deck specializes in Florida seafood with a Cajun twist.
950 US-1, Ormond Beach, FL 32174, USA
Eclectic menu ranging from Alaskan snow crab to Buffalo wings, served in a family-friendly setting.
810 S Atlantic Ave, Ormond Beach, FL 32176, USA
This beachside destination offers up an eclectic American menu, plus live music & drink specials.
867 S Atlantic Ave, Ormond Beach, FL 32176, USA
Casual restaurant & retail market with a large variety of seafood-focused selections.
111 W Granada Blvd, Ormond Beach, FL 32174, USA
Indoor grill with New American eats, plus an outdoor space with a tropical beach vibe & live music.
49 W Granada Blvd, Ormond Beach, FL 32174, USA
Source: Google Places. Names, addresses, photos and ratings are published by Google and can change.
Around here
Public parks inside this area's radius.
Low-key beachside park with modest recreational facilities, including a gazebo & playground.
839 S Atlantic Ave, Ormond Beach, FL 32176, USA
Website149-acre, 4-park complex with a lake, fishing pier & boat ramp, plus picnic pavilions & bike trails.
601 Fleming Ave, Ormond Beach, FL 32174, USA
WebsitePark
440 N Nova Rd, Ormond Beach, FL 32174, USA
Park
Milsap Rd, Ormond Beach, FL 32176, USA
Riverfront landscaped gardens including a waterfront path, a pond with a fountain & open air stage.
25 Riverside Dr, Ormond Beach, FL 32176, USA
WebsiteSource: Google Places. Names, addresses, photos and ratings are published by Google and can change.
Around here
Cinema, bowling, activities for the children, culture and sport around here, without repeating the parks. I list what actually exists, with the public Google rating where there is one.
Church
1000 Ocean Shore Blvd, Ormond Beach, FL 32176, USA
Museum featuring local & national artists, plus a landscaped memorial garden honoring WW veterans.
78 E Granada Blvd, Ormond Beach, FL 32176, USA
Athletic field
1060 Ridgewood Ave, Holly Hill, FL 32117, USA
Performing arts theater
399 US-1, Ormond Beach, FL 32174, USA
Named for its hand-carved windows, this riverside cultural center was once a J.D. Rockefeller home.
25 Riverside Dr, Ormond Beach, FL 32176, USA
Restaurant
1368 Ocean Shore Blvd, Ormond Beach, FL 32176, USA
Golf course
500 Calle Grande St, Ormond Beach, FL 32174, USA
Source: Google Places. Names, addresses, photos and ratings are published by Google and can change.
Real indicators
These numbers are published per county, not per neighbourhood or community. They show the direction of the market around this area, they do not estimate the price of a specific home.
The midpoint asking price of homes listed across the whole county that month. It is what sellers ask, not what buyers pay, and a county is far larger than a single community, a specific neighbourhood can sit well above or below it.
$365,000
median asking price (USD)
−3.7% vs. a year earlier
August 2026 · monthly series
Median listing price (county): from $328,996 in August 2021 to $365,000 in August 2026, higher over the period. Low of $328,996 in August 2021 and high of $400,000 in June 2022. 61 real observations.
August 2021, August 2026 · 61 observations
Realtor.com via FRED · St. Louis FedShowing 1 in every 2 real observations from the selected period.
| Period | Median listing price |
|---|---|
| August 2021 | $328,996 |
| October 2021 | $339,995 |
| December 2021 | $337,000 |
| February 2022 | $360,000 |
| April 2022 | $389,900 |
| June 2022 | $400,000 |
| August 2022 | $389,250 |
| October 2022 | $388,375 |
| December 2022 | $379,900 |
| February 2023 | $379,950 |
| April 2023 | $395,000 |
| June 2023 | $395,000 |
| August 2023 | $399,000 |
| October 2023 | $391,750 |
| December 2023 | $389,000 |
| February 2024 | $392,500 |
| April 2024 | $394,950 |
| June 2024 | $394,990 |
| August 2024 | $389,900 |
| October 2024 | $377,300 |
| December 2024 | $373,473 |
| February 2025 | $375,000 |
| April 2025 | $379,900 |
| June 2025 | $379,450 |
| August 2025 | $379,000 |
| October 2025 | $372,248 |
| December 2025 | $374,175 |
| February 2026 | $372,000 |
| April 2026 | $373,975 |
| June 2026 | $369,900 |
| August 2026 | $365,000 |
Realtor.com via FRED · St. Louis Fed · Housing Inventory: Median Listing Price in Volusia County, FL
Asking price divided by interior area, at the county midpoint. It travels better between areas than a total price because it partly removes house size from the comparison, but it still ignores lot, age, finish level and view.
$232
USD per square foot
−2.1% vs. a year earlier
August 2026 · monthly series
Median listing price per square foot (county): from $203 in August 2021 to $232 in August 2026, higher over the period. Low of $203 in August 2021 and high of $257 in July 2023. 61 real observations.
August 2021, August 2026 · 61 observations
Realtor.com via FRED · St. Louis FedShowing 1 in every 2 real observations from the selected period.
| Period | Price per sq ft |
|---|---|
| August 2021 | $203 |
| October 2021 | $205 |
| December 2021 | $210 |
| February 2022 | $224 |
| April 2022 | $234 |
| June 2022 | $241 |
| August 2022 | $236 |
| October 2022 | $235 |
| December 2022 | $231 |
| February 2023 | $240 |
| April 2023 | $250 |
| June 2023 | $254 |
| August 2023 | $256 |
| October 2023 | $250 |
| December 2023 | $248 |
| February 2024 | $254 |
| April 2024 | $252 |
| June 2024 | $250 |
| August 2024 | $249 |
| October 2024 | $244 |
| December 2024 | $243 |
| February 2025 | $245 |
| April 2025 | $244 |
| June 2025 | $239 |
| August 2025 | $237 |
| October 2025 | $232 |
| December 2025 | $234 |
| February 2026 | $236 |
| April 2026 | $235 |
| June 2026 | $235 |
| August 2026 | $232 |
Realtor.com via FRED · St. Louis Fed · Housing Inventory: Median Listing Price per Square Feet in Volusia County, FL
How many homes were actively listed for sale in the county during the month: a snapshot of available supply. It says nothing about how many sold and excludes homes already under contract.
4,115
active listings
−17.2% vs. a year earlier
August 2026 · monthly series
Active listings (county): from 1,481 in August 2021 to 4,115 in August 2026, higher over the period. Low of 1,001 in March 2022 and high of 5,388 in May 2025. 61 real observations.
August 2021, August 2026 · 61 observations
Realtor.com via FRED · St. Louis FedShowing 1 in every 2 real observations from the selected period.
| Period | Active listings |
|---|---|
| August 2021 | 1,481 |
| October 2021 | 1,525 |
| December 2021 | 1,364 |
| February 2022 | 1,052 |
| April 2022 | 1,003 |
| June 2022 | 1,584 |
| August 2022 | 2,357 |
| October 2022 | 2,316 |
| December 2022 | 2,530 |
| February 2023 | 2,546 |
| April 2023 | 2,354 |
| June 2023 | 2,554 |
| August 2023 | 2,710 |
| October 2023 | 3,164 |
| December 2023 | 3,369 |
| February 2024 | 3,633 |
| April 2024 | 3,924 |
| June 2024 | 4,387 |
| August 2024 | 4,356 |
| October 2024 | 4,499 |
| December 2024 | 4,479 |
| February 2025 | 4,850 |
| April 2025 | 5,273 |
| June 2025 | 5,357 |
| August 2025 | 4,971 |
| October 2025 | 4,575 |
| December 2025 | 4,393 |
| February 2026 | 4,283 |
| April 2026 | 4,305 |
| June 2026 | 4,211 |
| August 2026 | 4,115 |
Realtor.com via FRED · St. Louis Fed · Housing Inventory: Active Listing Count in Volusia County, FL
Homes that entered the county market for the first time that month. It measures how much new supply arrived, which is what usually changes negotiating room from one season to the next.
1,088
new listings in the month
+3.8% vs. a year earlier
August 2026 · monthly series
New listings (county): from 1,462 in August 2021 to 1,088 in August 2026, lower over the period. Low of 782 in December 2025 and high of 1,630 in February 2025. 61 real observations.
August 2021, August 2026 · 61 observations
Realtor.com via FRED · St. Louis FedShowing 1 in every 2 real observations from the selected period.
| Period | New listings |
|---|---|
| August 2021 | 1,462 |
| October 2021 | 1,236 |
| December 2021 | 986 |
| February 2022 | 1,322 |
| April 2022 | 1,364 |
| June 2022 | 1,550 |
| August 2022 | 1,398 |
| October 2022 | 948 |
| December 2022 | 876 |
| February 2023 | 1,254 |
| April 2023 | 1,164 |
| June 2023 | 1,208 |
| August 2023 | 1,180 |
| October 2023 | 1,078 |
| December 2023 | 852 |
| February 2024 | 1,282 |
| April 2024 | 1,414 |
| June 2024 | 1,252 |
| August 2024 | 1,184 |
| October 2024 | 1,178 |
| December 2024 | 980 |
| February 2025 | 1,630 |
| April 2025 | 1,462 |
| June 2025 | 1,176 |
| August 2025 | 1,048 |
| October 2025 | 1,018 |
| December 2025 | 782 |
| February 2026 | 1,166 |
| April 2026 | 1,250 |
| June 2026 | 1,118 |
| August 2026 | 1,088 |
Realtor.com via FRED · St. Louis Fed · Housing Inventory: New Listing Count in Volusia County, FL
The midpoint of how long county listings stayed on the market that month: half were listed for less, half for more. It measures pace, not price.
79
days on market
−11.2% vs. a year earlier
August 2026 · monthly series
Median days on market (county): from 32 in August 2021 to 79 in August 2026, higher over the period. Low of 28 in May 2022 and high of 91 in September 2025. 61 real observations.
August 2021, August 2026 · 61 observations
Realtor.com via FRED · St. Louis FedShowing 1 in every 2 real observations from the selected period.
| Period | Days on market |
|---|---|
| August 2021 | 32 |
| October 2021 | 39 |
| December 2021 | 50 |
| February 2022 | 31 |
| April 2022 | 29 |
| June 2022 | 29 |
| August 2022 | 38 |
| October 2022 | 60 |
| December 2022 | 63 |
| February 2023 | 57 |
| April 2023 | 54 |
| June 2023 | 50 |
| August 2023 | 57 |
| October 2023 | 53 |
| December 2023 | 64 |
| February 2024 | 66 |
| April 2024 | 62 |
| June 2024 | 64 |
| August 2024 | 73 |
| October 2024 | 82 |
| December 2024 | 86 |
| February 2025 | 73 |
| April 2025 | 69 |
| June 2025 | 80 |
| August 2025 | 89 |
| October 2025 | 88 |
| December 2025 | 88 |
| February 2026 | 83 |
| April 2026 | 73 |
| June 2026 | 74 |
| August 2026 | 79 |
Realtor.com via FRED · St. Louis Fed · Housing Inventory: Median Days on Market in Volusia County, FL
Median listing price
$415,000
median asking price (USD)
−1.9% vs. a year earlier
August 2026 · monthly series
Florida house price index
825.7
index · base 1980:Q1 = 100
+1.4% vs. a year earlier
Q2 2026 · quarterly series
30-year fixed mortgage rate
6.76%
annual rate
+0.41 percentage points vs. a year earlier
Week ending Sep 10, 2026 · weekly average
Honest trade-offs
Trade-offs
Compare
A master-planned area in southeast Orlando organized around health, education, technology and an unusually connected network of trails and parks.
OpenA city west of Orlando with a genuine historic downtown, wrapped by newer residential communities built over the last two decades.
OpenA low-density, lake-oriented area on the Butler Chain of Lakes, known for large lots, mature oaks and privacy.
OpenNext step
Goals, budget, timing and the regions that fit you, with no obligation.