Identity
New Smyrna kept a height-limited beachside and a walkable historic downtown on the Indian River. The result feels closer to a coastal town than to a resort strip, with a strong local arts and surf culture.
Volusia County
Greater OrlandoFlorida
A low-rise Atlantic beach town south of Daytona, known for surfing, an arts district and Canaveral National Seashore at its southern end.
New Smyrna kept a height-limited beachside and a walkable historic downtown on the Indian River. The result feels closer to a coastal town than to a resort strip, with a strong local arts and surf culture.
Southeast Volusia County on the Atlantic and the Indian River, reached by I-95 and SR-44.
Day to day, this is what you can expect: beach mornings, Canal Street and Flagler Avenue for dining and shops, river access for boating.
constrained on the beachside by height rules; more active on the mainland side.
car-based, with walkable pockets in both commercial districts.
The area
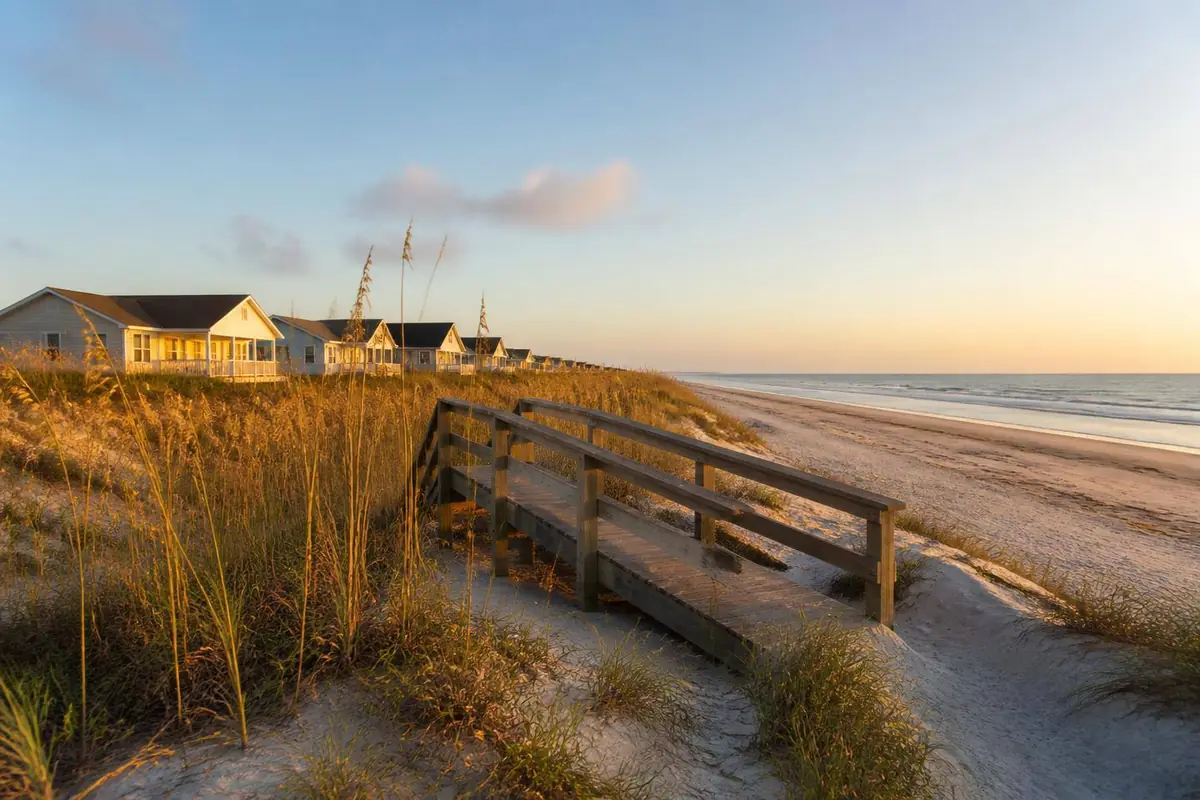
A surf-break coastline backed by a historic sugar-mill downtown.
Real life here
Days tend to start early with surf checks on the beach, then move into the walkable blocks of Flagler Avenue or Canal Street for coffee, errands and lunch. The Indian River side of town runs at a slower, more residential pace, and Ponce Inlet at the southern tip is where boating and fishing routines concentrate.
Flagler Avenue and Canal Street carry most of the restaurants and cafés, independently owned rather than chain-heavy, with outdoor seating typical of a beach town. Larger grocery stores sit on the mainland side of the river, a short drive from the beachside blocks.
Everyday services, pharmacies and clinics are available in town, with fuller medical and retail options a short drive north toward Edgewater or west across the river.
Hurricane season runs June through November, and low-lying beachside streets and homes near Ponce Inlet carry real flood exposure, which is part of why wind and flood insurance are a routine budgeting item rather than a surprise. Visitor numbers climb in the warmer months and around holiday weekends, adding to beach and parking traffic on Flagler Avenue and Canal Street.
Around here
Real institutions inside this area's radius, ordered by distance. No ratings: assignment depends on the exact address, and a star average does not measure a school.
Source: Google Places. Names, addresses, photos and ratings are published by Google and can change.
Around here
Real addresses nearby, with public Google ratings where they exist.
Cozy hub with gourmet coffee, sandwiches & pizzas, global wines & craft beers, plus a garden patio.
204 Flagler Ave, New Smyrna Beach, FL 32169, USA
Old-school atmosphere for classic Italian entrees including eggplant Parmesan & osso buco.
556 E 3rd Ave, New Smyrna Beach, FL 32169, USA
Homey eatery offers a diverse menu of seafood & beef in a relaxed, family-friendly atmosphere.
701 N Dixie Fwy, New Smyrna Beach, FL 32168, USA
Updated Southern comfort classics in a relaxed setting with exposed-brick walls & a full bar.
235 Canal St, New Smyrna Beach, FL 32168, USA
Old-school seafood restaurant with a retro feel, an expansive wine menu & a retail shop.
400 2nd Ave E, New Smyrna Beach, FL 32169, USA
Scallops & other seafood specialties star at this cozy eatery along with fried appetizers & dessert.
1414 S Atlantic Ave, New Smyrna Beach, FL 32169, USA
Restaurant
392 Flagler Ave, New Smyrna Beach, FL 32169, USA
Seafood restaurant
203 S Atlantic Ave, New Smyrna Beach, FL 32169, USA
Bar & grill
107 N Riverside Dr, New Smyrna Beach, FL 32168, USA
Source: Google Places. Names, addresses, photos and ratings are published by Google and can change.
Around here
Public parks inside this area's radius.
Pets are allowed on leash at this large public park with an array of land & water activities.
2995 N Peninsula Ave, New Smyrna Beach, FL 32169, USA
WebsitePark
201 Buenos Aires St, New Smyrna Beach, FL 32169, USA
Park
Beachway Ave, New Smyrna Beach, FL 32169, USA
Quaint park on the banks of the Indian River known for its fishing, playground & open space.
299 S Riverside Dr, New Smyrna Beach, FL 32168, USA
Easygoing park with grassy spots, restroom & outdoor shower facilities & a beach with fire pits.
1100 N Atlantic Ave, New Smyrna Beach, FL 32169, USA
Public park and green space
2455 Boat Ramp Dr, New Smyrna Beach, FL 32168, USA
Source: Google Places. Names, addresses, photos and ratings are published by Google and can change.
Around here
Cinema, bowling, activities for the children, culture and sport around here, without repeating the parks. I list what actually exists, with the public Google rating where there is one.
Tourist attraction
520 Barracuda Blvd, New Smyrna Beach, FL 32169, USA
Tourist attraction
New Smyrna Beach, FL 32169, USA
Festive harborside tavern with a wraparound bar & a patio serving comfort eats & exotic cocktails.
200 Boatyard St, New Smyrna Beach, FL 32169, USA
Golf course
1000 Wayne Ave, New Smyrna Beach, FL 32168, USA
Golf course
35 Fairgreen Ave, New Smyrna Beach, FL 32168, USA
Bowling alley
185 Causeway N, New Smyrna Beach, FL 32169, USA
Movie theater
1401 S Dixie Fwy, New Smyrna Beach, FL 32168, USA
Source: Google Places. Names, addresses, photos and ratings are published by Google and can change.
Real indicators
These numbers are published per county, not per neighbourhood or community. They show the direction of the market around this area, they do not estimate the price of a specific home.
The midpoint asking price of homes listed across the whole county that month. It is what sellers ask, not what buyers pay, and a county is far larger than a single community, a specific neighbourhood can sit well above or below it.
$362,250
median asking price (USD)
−3.4% vs. a year earlier
September 2026 · monthly series
Median listing price (county): from $329,900 in September 2021 to $362,250 in September 2026, higher over the period. Low of $329,900 in September 2021 and high of $400,000 in June 2022. 61 real observations.
September 2021, September 2026 · 61 observations
Realtor.com via FRED · St. Louis FedShowing 1 in every 2 real observations from the selected period.
| Period | Median listing price |
|---|---|
| September 2021 | $329,900 |
| November 2021 | $339,000 |
| January 2022 | $339,000 |
| March 2022 | $369,500 |
| May 2022 | $392,600 |
| July 2022 | $394,900 |
| September 2022 | $387,000 |
| November 2022 | $384,104 |
| January 2023 | $379,900 |
| March 2023 | $388,765 |
| May 2023 | $395,104 |
| July 2023 | $395,500 |
| September 2023 | $396,900 |
| November 2023 | $388,950 |
| January 2024 | $390,141 |
| March 2024 | $390,000 |
| May 2024 | $394,750 |
| July 2024 | $392,500 |
| September 2024 | $379,975 |
| November 2024 | $374,999 |
| January 2025 | $375,000 |
| March 2025 | $375,000 |
| May 2025 | $379,900 |
| July 2025 | $379,900 |
| September 2025 | $375,000 |
| November 2025 | $370,245 |
| January 2026 | $374,900 |
| March 2026 | $370,250 |
| May 2026 | $369,900 |
| July 2026 | $367,000 |
| September 2026 | $362,250 |
Realtor.com via FRED · St. Louis Fed · Housing Inventory: Median Listing Price in Volusia County, FL
Asking price divided by interior area, at the county midpoint. It travels better between areas than a total price because it partly removes house size from the comparison, but it still ignores lot, age, finish level and view.
$231
USD per square foot
−1.3% vs. a year earlier
September 2026 · monthly series
Median listing price per square foot (county): from $204 in September 2021 to $231 in September 2026, higher over the period. Low of $204 in September 2021 and high of $257 in July 2023. 61 real observations.
September 2021, September 2026 · 61 observations
Realtor.com via FRED · St. Louis FedShowing 1 in every 2 real observations from the selected period.
| Period | Price per sq ft |
|---|---|
| September 2021 | $204 |
| November 2021 | $208 |
| January 2022 | $211 |
| March 2022 | $229 |
| May 2022 | $237 |
| July 2022 | $238 |
| September 2022 | $235 |
| November 2022 | $232 |
| January 2023 | $237 |
| March 2023 | $244 |
| May 2023 | $253 |
| July 2023 | $257 |
| September 2023 | $252 |
| November 2023 | $248 |
| January 2024 | $253 |
| March 2024 | $253 |
| May 2024 | $253 |
| July 2024 | $250 |
| September 2024 | $244 |
| November 2024 | $242 |
| January 2025 | $245 |
| March 2025 | $244 |
| May 2025 | $242 |
| July 2025 | $238 |
| September 2025 | $234 |
| November 2025 | $233 |
| January 2026 | $236 |
| March 2026 | $235 |
| May 2026 | $234 |
| July 2026 | $234 |
| September 2026 | $231 |
Realtor.com via FRED · St. Louis Fed · Housing Inventory: Median Listing Price per Square Feet in Volusia County, FL
How many homes were actively listed for sale in the county during the month: a snapshot of available supply. It says nothing about how many sold and excludes homes already under contract.
4,171
active listings
−11.8% vs. a year earlier
September 2026 · monthly series
Active listings (county): from 1,551 in September 2021 to 4,171 in September 2026, higher over the period. Low of 1,001 in March 2022 and high of 5,388 in May 2025. 61 real observations.
September 2021, September 2026 · 61 observations
Realtor.com via FRED · St. Louis FedShowing 1 in every 2 real observations from the selected period.
| Period | Active listings |
|---|---|
| September 2021 | 1,551 |
| November 2021 | 1,477 |
| January 2022 | 1,190 |
| March 2022 | 1,001 |
| May 2022 | 1,297 |
| July 2022 | 2,093 |
| September 2022 | 2,360 |
| November 2022 | 2,473 |
| January 2023 | 2,523 |
| March 2023 | 2,420 |
| May 2023 | 2,466 |
| July 2023 | 2,619 |
| September 2023 | 2,931 |
| November 2023 | 3,334 |
| January 2024 | 3,421 |
| March 2024 | 3,810 |
| May 2024 | 4,114 |
| July 2024 | 4,399 |
| September 2024 | 4,517 |
| November 2024 | 4,606 |
| January 2025 | 4,461 |
| March 2025 | 5,093 |
| May 2025 | 5,388 |
| July 2025 | 5,232 |
| September 2025 | 4,731 |
| November 2025 | 4,535 |
| January 2026 | 4,240 |
| March 2026 | 4,315 |
| May 2026 | 4,252 |
| July 2026 | 4,210 |
| September 2026 | 4,171 |
Realtor.com via FRED · St. Louis Fed · Housing Inventory: Active Listing Count in Volusia County, FL
Homes that entered the county market for the first time that month. It measures how much new supply arrived, which is what usually changes negotiating room from one season to the next.
1,108
new listings in the month
+7.2% vs. a year earlier
September 2026 · monthly series
New listings (county): from 1,318 in September 2021 to 1,108 in September 2026, lower over the period. Low of 782 in December 2025 and high of 1,630 in February 2025. 61 real observations.
September 2021, September 2026 · 61 observations
Realtor.com via FRED · St. Louis FedShowing 1 in every 2 real observations from the selected period.
| Period | New listings |
|---|---|
| September 2021 | 1,318 |
| November 2021 | 1,272 |
| January 2022 | 1,220 |
| March 2022 | 1,416 |
| May 2022 | 1,560 |
| July 2022 | 1,568 |
| September 2022 | 1,184 |
| November 2022 | 912 |
| January 2023 | 1,086 |
| March 2023 | 1,106 |
| May 2023 | 1,178 |
| July 2023 | 1,136 |
| September 2023 | 1,196 |
| November 2023 | 1,058 |
| January 2024 | 1,230 |
| March 2024 | 1,276 |
| May 2024 | 1,386 |
| July 2024 | 1,240 |
| September 2024 | 1,086 |
| November 2024 | 1,136 |
| January 2025 | 1,388 |
| March 2025 | 1,452 |
| May 2025 | 1,336 |
| July 2025 | 1,066 |
| September 2025 | 1,034 |
| November 2025 | 1,044 |
| January 2026 | 1,252 |
| March 2026 | 1,246 |
| May 2026 | 1,220 |
| July 2026 | 1,116 |
| September 2026 | 1,108 |
Realtor.com via FRED · St. Louis Fed · Housing Inventory: New Listing Count in Volusia County, FL
The midpoint of how long county listings stayed on the market that month: half were listed for less, half for more. It measures pace, not price.
78
days on market
−14.3% vs. a year earlier
September 2026 · monthly series
Median days on market (county): from 36 in September 2021 to 78 in September 2026, higher over the period. Low of 28 in May 2022 and high of 91 in September 2025. 61 real observations.
September 2021, September 2026 · 61 observations
Realtor.com via FRED · St. Louis FedShowing 1 in every 2 real observations from the selected period.
| Period | Days on market |
|---|---|
| September 2021 | 36 |
| November 2021 | 42 |
| January 2022 | 44 |
| March 2022 | 31 |
| May 2022 | 28 |
| July 2022 | 31 |
| September 2022 | 49 |
| November 2022 | 63 |
| January 2023 | 65 |
| March 2023 | 54 |
| May 2023 | 50 |
| July 2023 | 56 |
| September 2023 | 53 |
| November 2023 | 58 |
| January 2024 | 67 |
| March 2024 | 57 |
| May 2024 | 61 |
| July 2024 | 67 |
| September 2024 | 76 |
| November 2024 | 85 |
| January 2025 | 80 |
| March 2025 | 65 |
| May 2025 | 73 |
| July 2025 | 87 |
| September 2025 | 91 |
| November 2025 | 86 |
| January 2026 | 88 |
| March 2026 | 70 |
| May 2026 | 73 |
| July 2026 | 76 |
| September 2026 | 78 |
Realtor.com via FRED · St. Louis Fed · Housing Inventory: Median Days on Market in Volusia County, FL
Median listing price
$410,000
median asking price (USD)
−2.5% vs. a year earlier
September 2026 · monthly series
Florida house price index
825.7
index · base 1980:Q1 = 100
+1.4% vs. a year earlier
Q2 2026 · quarterly series
30-year fixed mortgage rate
7.24%
annual rate
+1.07 percentage points vs. a year earlier
Week ending Oct 29, 2026 · weekly average
Honest trade-offs
Trade-offs
Compare
A master-planned area in southeast Orlando organized around health, education, technology and an unusually connected network of trails and parks.
OpenA city west of Orlando with a genuine historic downtown, wrapped by newer residential communities built over the last two decades.
OpenA low-density, lake-oriented area on the Butler Chain of Lakes, known for large lots, mature oaks and privacy.
OpenNext step
Goals, budget, timing and the regions that fit you, with no obligation.