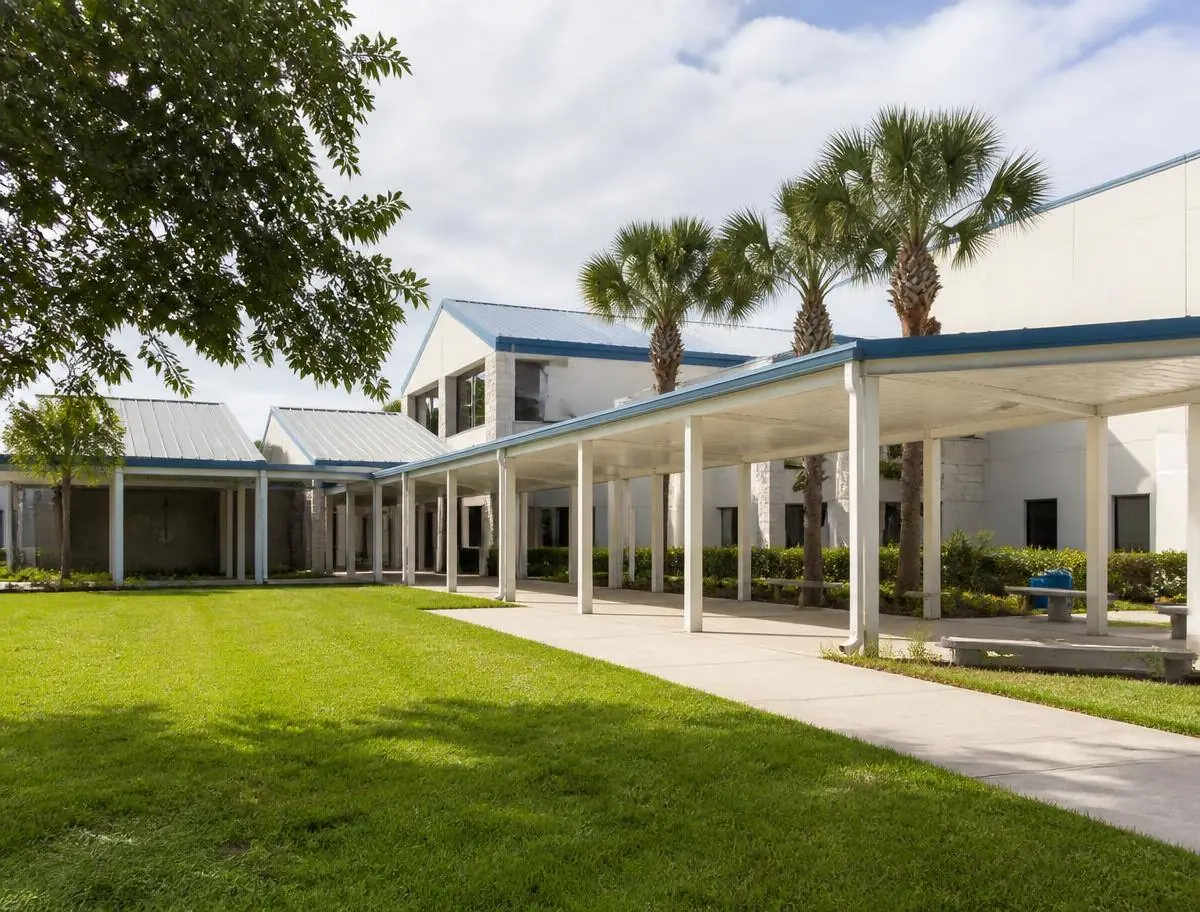
Identity
Minneola has some of the highest elevation in the region, which gives the newer subdivisions long views and the older roads real gradient. Its growth is tied directly to the Turnpike interchange and the Hills of Minneola plan.
Lake County
Greater OrlandoFlorida
A hillside city north of Clermont with lake frontage, steep terrain and rapid new-community growth near the Turnpike interchange.
Minneola has some of the highest elevation in the region, which gives the newer subdivisions long views and the older roads real gradient. Its growth is tied directly to the Turnpike interchange and the Hills of Minneola plan.
South Lake County on US-27, immediately north of Clermont.
Here is what I'd tell you about daily life: trail riding and lake access on one side; Clermont's retail corridor on the other.
Something worth watching: very active, with large phased communities delivering around the interchange.
For getting around, here is what you should know: car-based; US-27 and the Turnpike are the main links.
The area
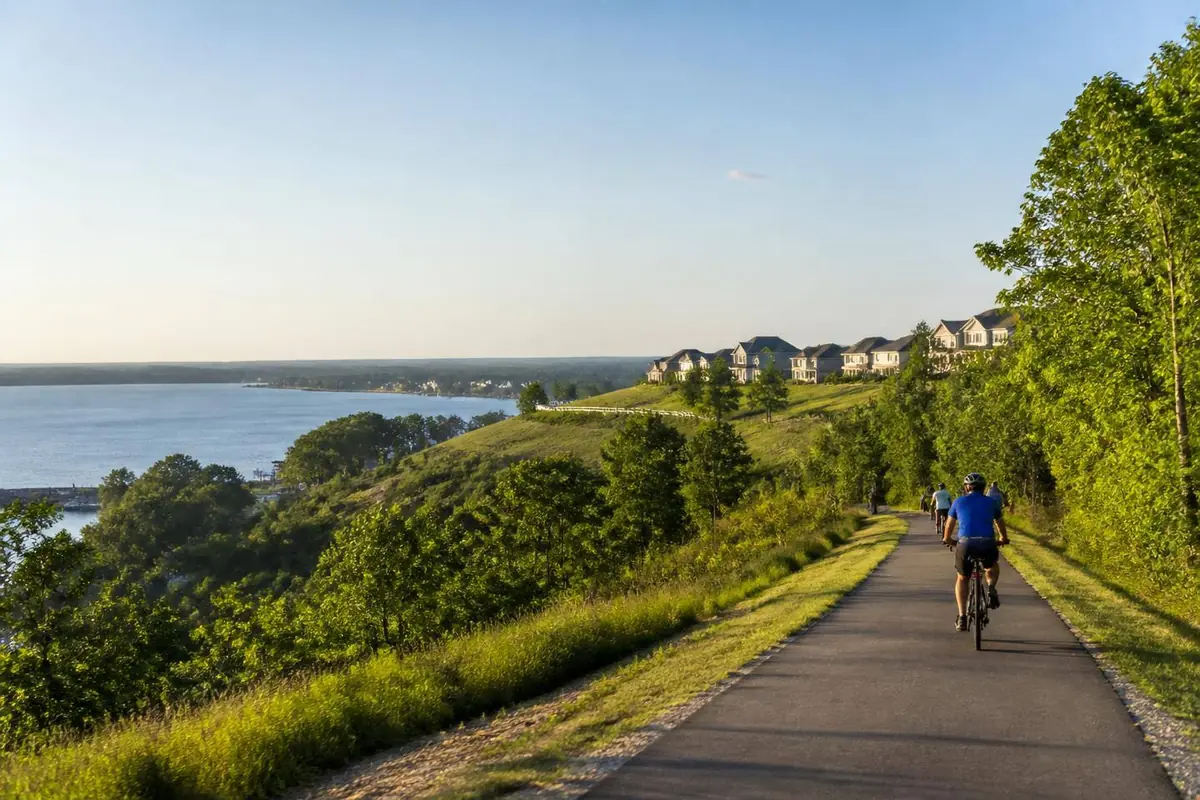
Hilltop neighborhoods overlooking a chain of lakes along the Turnpike.
Real life here
Elevation shapes the routine here more than in most of the region: long views from the newer hillside subdivisions, real gradient on the older roads, and the South Lake Trail and Lake Minneola waterfront for cycling and paddling. The Turnpike interchange puts Clermont's retail corridor and Orlando both within easy reach.
Everyday dining sits mostly around the Turnpike interchange and along US-27; Clermont, a few minutes south, adds a fuller restaurant and grocery selection.
Pharmacies, banks and clinics are arriving along US-27 as new phases open; hospitals and fuller specialist care are in Clermont.
US-27 traffic is heaviest at commuting hours and grows with each new phase; hilly lots can affect drainage after heavy summer rain, worth checking per address.
Around here
Real institutions inside this area's radius, ordered by distance. No ratings: assignment depends on the exact address, and a star average does not measure a school.
Primary school
355 Citrus Tower Blvd #116, Clermont, FL 34711, USA
WebsiteElementary school
680 E Highland Ave, Clermont, FL 34711, USA
Source: Google Places. Names, addresses, photos and ratings are published by Google and can change.
Around here
Real addresses nearby, with public Google ratings where they exist.
Mexican restaurant
794 W Minneola Ave, Clermont, FL 34711, USA
Easygoing hangout on Lake Minneloa featuring American eats, brews & scenic outdoor seating.
508 S Main Ave, Minneola, FL 34715, USA
Chef-driven pub born of a food truck with craft beer & local ingredients in the eats & cocktails.
200 Citrus Tower Blvd, Clermont, FL 34711, USA
This charming downtown area features historic houses & buildings, retail shops & restaurants.
670 W Montrose St, Clermont, FL 34711, USA
Seafood restaurant
846 W Osceola St, Clermont, FL 34711, USA
Italian restaurant
798 W Montrose St, Clermont, FL 34711, USA
A menu specializing in British-style fish & chips in a family-friendly setting with rustic decor.
110 W Hwy 50, Clermont, FL 34711, USA
Casual chain featuring BBQ & classic sides, plus memorabilia honoring soldiers & first responders.
1225 E Hwy 50, Clermont, FL 34711, USA
Wide variety of Asian dishes at an all-you-can-eat buffet with nondescript exterior & quick service.
1036 E Hwy 50, Clermont, FL 34711, USA
Source: Google Places. Names, addresses, photos and ratings are published by Google and can change.
Around here
Public parks inside this area's radius.
Lakefront park offering a fishing pier, a paved walking trail, a playground & seasonal swimming.
330 3rd St, Clermont, FL 34711, USA
WebsitePark
features, S Lake Trail (Lake Apopka Trail), Clermont, FL 34711, USA
Park featuring a playground, basketball courts, a softball field, a fitness trail & restrooms.
801 Bloxam Ave, Clermont, FL 34711, USA
WebsiteSource: Google Places. Names, addresses, photos and ratings are published by Google and can change.
Around here
Cinema, bowling, activities for the children, culture and sport around here, without repeating the parks. I list what actually exists, with the public Google rating where there is one.
Preserved historic structures, including a school, train depot, WWII-era Quonset hut & 2 homes.
490 West Ave, Clermont, FL 34711, USA
Easygoing hangout on Lake Minneloa featuring American eats, brews & scenic outdoor seating.
508 S Main Ave, Minneola, FL 34715, USA
Gym offering fitness equipment, classes & personal training, plus childcare & a women's only area.
1050 FL-50, Clermont, FL 34711, USA
This seasonal recreational activity for children has water jets & sprays with a modern design.
100 3rd St, Clermont, FL 34711, USA
Old-school tower, built in 1956, offering 360-degree views from its 226 ft.-high observation deck.
141 N Hwy 27, Clermont, FL 34711, USA
This museum dedicated to U.S. Presidents & their families also has a miniature White House replica.
123 Hwy 27N, Clermont, FL 34711, USA
Bowling alley
4 Westgate Plaza, Clermont, FL 34711, USA
Source: Google Places. Names, addresses, photos and ratings are published by Google and can change.
Real indicators
These numbers are published per county, not per neighbourhood or community. They show the direction of the market around this area, they do not estimate the price of a specific home.
The midpoint asking price of homes listed across the whole county that month. It is what sellers ask, not what buyers pay, and a county is far larger than a single community, a specific neighbourhood can sit well above or below it.
$399,999
median asking price (USD)
−1.8% vs. a year earlier
September 2026 · monthly series
Median listing price (county): from $372,259 in September 2021 to $399,999 in September 2026, higher over the period. Low of $372,259 in September 2021 and high of $449,400 in June 2022. 61 real observations.
September 2021, September 2026 · 61 observations
Realtor.com via FRED · St. Louis FedShowing 1 in every 2 real observations from the selected period.
| Period | Median listing price |
|---|---|
| September 2021 | $372,259 |
| November 2021 | $376,698 |
| January 2022 | $399,000 |
| March 2022 | $394,600 |
| May 2022 | $432,488 |
| July 2022 | $433,690 |
| September 2022 | $406,555 |
| November 2022 | $402,009 |
| January 2023 | $399,700 |
| March 2023 | $408,581 |
| May 2023 | $404,303 |
| July 2023 | $425,000 |
| September 2023 | $420,000 |
| November 2023 | $415,000 |
| January 2024 | $410,750 |
| March 2024 | $420,000 |
| May 2024 | $422,500 |
| July 2024 | $420,000 |
| September 2024 | $415,749 |
| November 2024 | $409,900 |
| January 2025 | $407,000 |
| March 2025 | $410,000 |
| May 2025 | $416,900 |
| July 2025 | $409,987 |
| September 2025 | $407,450 |
| November 2025 | $399,900 |
| January 2026 | $399,000 |
| March 2026 | $399,900 |
| May 2026 | $400,000 |
| July 2026 | $402,950 |
| September 2026 | $399,999 |
Realtor.com via FRED · St. Louis Fed · Housing Inventory: Median Listing Price in Lake County, FL
Asking price divided by interior area, at the county midpoint. It travels better between areas than a total price because it partly removes house size from the comparison, but it still ignores lot, age, finish level and view.
$211
USD per square foot
−1.4% vs. a year earlier
September 2026 · monthly series
Median listing price per square foot (county): from $186 in September 2021 to $211 in September 2026, higher over the period. Low of $186 in September 2021 and high of $220 in May 2022. 61 real observations.
September 2021, September 2026 · 61 observations
Realtor.com via FRED · St. Louis FedShowing 1 in every 2 real observations from the selected period.
| Period | Price per sq ft |
|---|---|
| September 2021 | $186 |
| November 2021 | $191 |
| January 2022 | $199 |
| March 2022 | $206 |
| May 2022 | $220 |
| July 2022 | $218 |
| September 2022 | $214 |
| November 2022 | $211 |
| January 2023 | $209 |
| March 2023 | $208 |
| May 2023 | $211 |
| July 2023 | $218 |
| September 2023 | $218 |
| November 2023 | $219 |
| January 2024 | $219 |
| March 2024 | $219 |
| May 2024 | $219 |
| July 2024 | $219 |
| September 2024 | $219 |
| November 2024 | $217 |
| January 2025 | $216 |
| March 2025 | $217 |
| May 2025 | $216 |
| July 2025 | $215 |
| September 2025 | $214 |
| November 2025 | $213 |
| January 2026 | $213 |
| March 2026 | $212 |
| May 2026 | $210 |
| July 2026 | $212 |
| September 2026 | $211 |
Realtor.com via FRED · St. Louis Fed · Housing Inventory: Median Listing Price per Square Feet in Lake County, FL
How many homes were actively listed for sale in the county during the month: a snapshot of available supply. It says nothing about how many sold and excludes homes already under contract.
2,513
active listings
+3.1% vs. a year earlier
September 2026 · monthly series
Active listings (county): from 750 in September 2021 to 2,513 in September 2026, higher over the period. Low of 480 in March 2022 and high of 2,520 in August 2026. 61 real observations.
September 2021, September 2026 · 61 observations
Realtor.com via FRED · St. Louis FedShowing 1 in every 2 real observations from the selected period.
| Period | Active listings |
|---|---|
| September 2021 | 750 |
| November 2021 | 675 |
| January 2022 | 580 |
| March 2022 | 480 |
| May 2022 | 682 |
| July 2022 | 1,114 |
| September 2022 | 1,275 |
| November 2022 | 1,416 |
| January 2023 | 1,280 |
| March 2023 | 1,170 |
| May 2023 | 1,070 |
| July 2023 | 1,129 |
| September 2023 | 1,313 |
| November 2023 | 1,496 |
| January 2024 | 1,528 |
| March 2024 | 1,542 |
| May 2024 | 1,698 |
| July 2024 | 1,933 |
| September 2024 | 2,127 |
| November 2024 | 2,222 |
| January 2025 | 2,203 |
| March 2025 | 2,318 |
| May 2025 | 2,434 |
| July 2025 | 2,491 |
| September 2025 | 2,437 |
| November 2025 | 2,413 |
| January 2026 | 2,310 |
| March 2026 | 2,455 |
| May 2026 | 2,469 |
| July 2026 | 2,510 |
| September 2026 | 2,513 |
Realtor.com via FRED · St. Louis Fed · Housing Inventory: Active Listing Count in Lake County, FL
Homes that entered the county market for the first time that month. It measures how much new supply arrived, which is what usually changes negotiating room from one season to the next.
688
new listings in the month
−3.1% vs. a year earlier
September 2026 · monthly series
New listings (county): from 686 in September 2021 to 688 in September 2026, higher over the period. Low of 472 in December 2022 and high of 918 in April 2025. 61 real observations.
September 2021, September 2026 · 61 observations
Realtor.com via FRED · St. Louis FedShowing 1 in every 2 real observations from the selected period.
| Period | New listings |
|---|---|
| September 2021 | 686 |
| November 2021 | 628 |
| January 2022 | 612 |
| March 2022 | 754 |
| May 2022 | 862 |
| July 2022 | 840 |
| September 2022 | 682 |
| November 2022 | 488 |
| January 2023 | 576 |
| March 2023 | 662 |
| May 2023 | 634 |
| July 2023 | 600 |
| September 2023 | 596 |
| November 2023 | 616 |
| January 2024 | 610 |
| March 2024 | 784 |
| May 2024 | 778 |
| July 2024 | 720 |
| September 2024 | 696 |
| November 2024 | 600 |
| January 2025 | 736 |
| March 2025 | 852 |
| May 2025 | 776 |
| July 2025 | 680 |
| September 2025 | 710 |
| November 2025 | 684 |
| January 2026 | 820 |
| March 2026 | 796 |
| May 2026 | 872 |
| July 2026 | 814 |
| September 2026 | 688 |
Realtor.com via FRED · St. Louis Fed · Housing Inventory: New Listing Count in Lake County, FL
The midpoint of how long county listings stayed on the market that month: half were listed for less, half for more. It measures pace, not price.
74
days on market
−3.9% vs. a year earlier
September 2026 · monthly series
Median days on market (county): from 38 in September 2021 to 74 in September 2026, higher over the period. Low of 28 in May 2022 and high of 82 in January 2026. 61 real observations.
September 2021, September 2026 · 61 observations
Realtor.com via FRED · St. Louis FedShowing 1 in every 2 real observations from the selected period.
| Period | Days on market |
|---|---|
| September 2021 | 38 |
| November 2021 | 43 |
| January 2022 | 46 |
| March 2022 | 34 |
| May 2022 | 28 |
| July 2022 | 32 |
| September 2022 | 49 |
| November 2022 | 60 |
| January 2023 | 73 |
| March 2023 | 53 |
| May 2023 | 49 |
| July 2023 | 49 |
| September 2023 | 51 |
| November 2023 | 52 |
| January 2024 | 69 |
| March 2024 | 54 |
| May 2024 | 49 |
| July 2024 | 57 |
| September 2024 | 64 |
| November 2024 | 72 |
| January 2025 | 81 |
| March 2025 | 59 |
| May 2025 | 64 |
| July 2025 | 76 |
| September 2025 | 77 |
| November 2025 | 79 |
| January 2026 | 82 |
| March 2026 | 64 |
| May 2026 | 72 |
| July 2026 | 72 |
| September 2026 | 74 |
Realtor.com via FRED · St. Louis Fed · Housing Inventory: Median Days on Market in Lake County, FL
Median listing price
$410,000
median asking price (USD)
−2.5% vs. a year earlier
September 2026 · monthly series
Florida house price index
825.7
index · base 1980:Q1 = 100
+1.4% vs. a year earlier
Q2 2026 · quarterly series
30-year fixed mortgage rate
7.24%
annual rate
+1.07 percentage points vs. a year earlier
Week ending Oct 29, 2026 · weekly average
Honest trade-offs
Trade-offs
Compare
A master-planned area in southeast Orlando organized around health, education, technology and an unusually connected network of trails and parks.
OpenA city west of Orlando with a genuine historic downtown, wrapped by newer residential communities built over the last two decades.
OpenA low-density, lake-oriented area on the Butler Chain of Lakes, known for large lots, mature oaks and privacy.
OpenNext step
Goals, budget, timing and the regions that fit you, with no obligation.