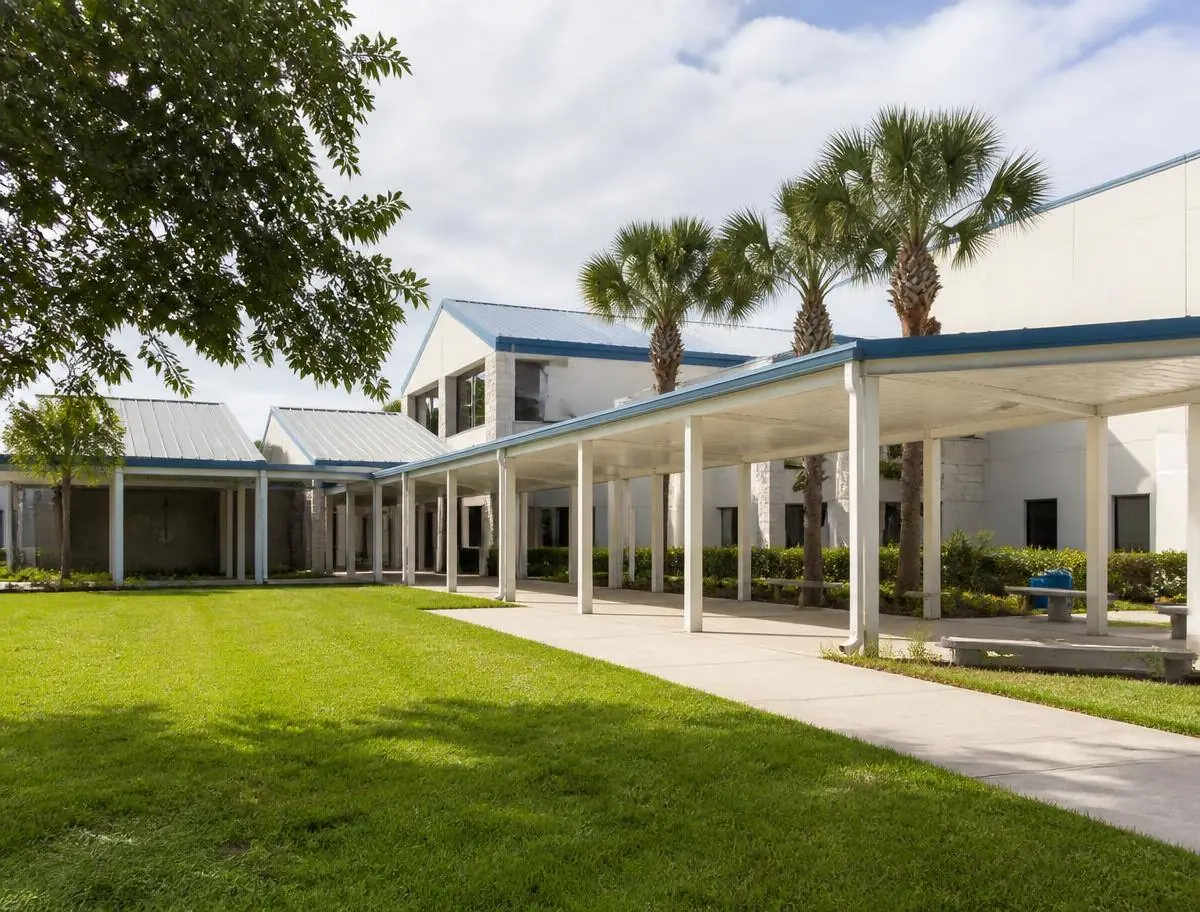
Identity
Apopka was a nursery and farming centre long before it became a commuter city. Both layers are still visible: an old downtown and working land on one side, new residential phases and highway retail on the other.
Orange County
Greater OrlandoFlorida
A growing city northwest of Orlando with a long agricultural history, large conservation areas and a wave of newer subdivisions along the SR-429 corridor.
Apopka was a nursery and farming centre long before it became a commuter city. Both layers are still visible: an old downtown and working land on one side, new residential phases and highway retail on the other.
Northwest Orange County, on US-441 and SR-429, near Wekiwa Springs.
Here is what I'd tell you about daily life: outdoors is a real part of the routine here, springs, trails and lakes, alongside standard suburban errands on the main highways.
Something worth watching: this is one of the busiest new-home corridors north of Orlando, with several builders active in sequential phases.
For getting around, here is what you should know: car-based; SR-429 shortens trips west and south, US-441 carries local traffic.
The area
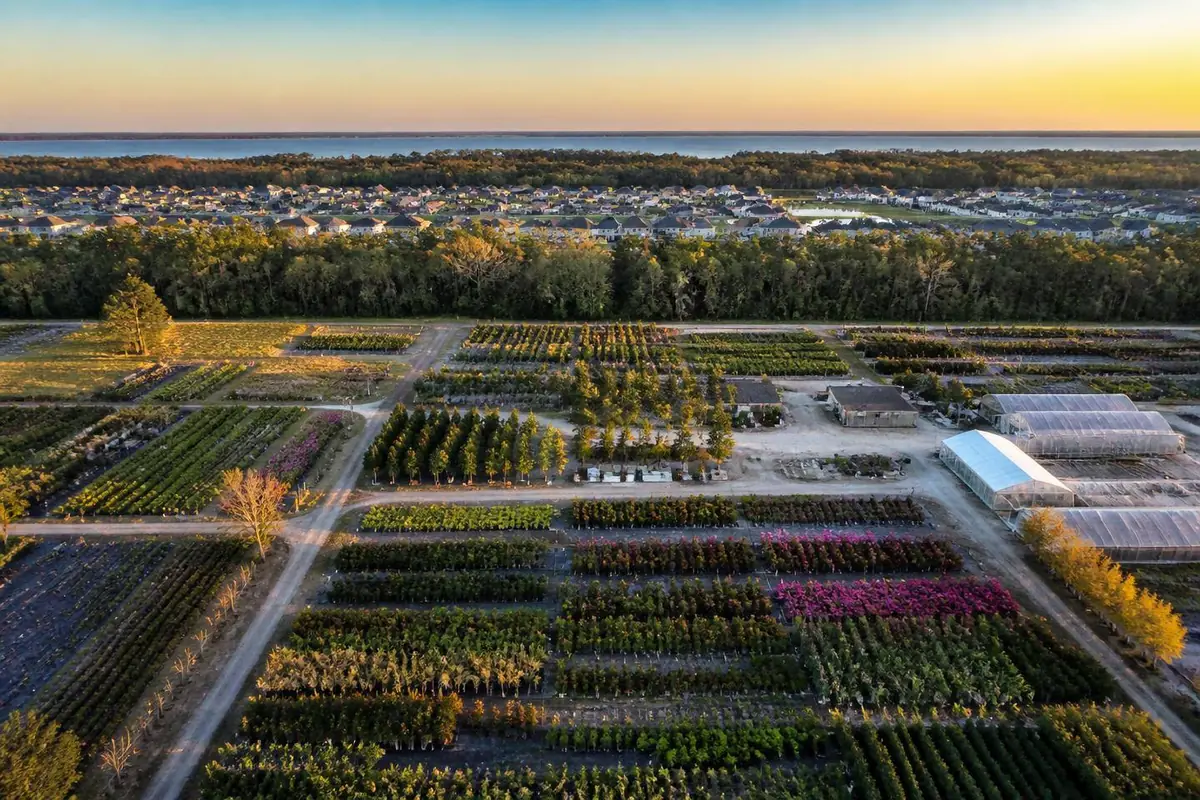
Lake-dotted farmland giving way to new subdivisions at the edge of the hills.
Real life here
Two layers run side by side: a working agricultural and nursery history around the historic downtown on Park Avenue, and a newer commuter routine along SR-429 with springs, trails and lakes filling weekends. Wekiwa Springs and Kelly Park draw both the people who live here and day visitors.
The historic downtown along Park Avenue has a small set of independent restaurants and cafés; everyday chain dining and larger supermarkets line US-441 and the SR-429 corridor.
Groceries, pharmacies and urgent care are spread along US-441 and SR-429; hospitals are reached via those same corridors toward Orlando or the AdventHealth network further south.
Wekiwa Springs and Kelly Park are busiest on warm-weather weekends and holidays, sometimes reaching capacity; SR-429 construction traffic is an ongoing feature of the corridor.
Around here
Real institutions inside this area's radius, ordered by distance. No ratings: assignment depends on the exact address, and a star average does not measure a school.
High school
800 Wells St, Apopka, FL 32712, USA
School
Apopka, FL 32712, USA
Source: Google Places. Names, addresses, photos and ratings are published by Google and can change.
Around here
Real addresses nearby, with public Google ratings where they exist.
Informal restaurant serving New England-inspired seafood, including lobster & oyster dishes.
311 S Forest Ave, Apopka, FL 32703, USA
Refined but unpretentious choice featuring Black Angus steaks, wine, cocktails & craft beer on tap.
1418 Rock Springs Rd, Apopka, FL 32712, USA
Long-standing chain serving a wide variety of pancakes & other American breakfast & diner fare.
1120 W Orange Blossom Trail, Apopka, FL 32712, USA
Casual sports-pub chain with basics from bar snacks to steaks & a large selection of tap beers.
505 E Main St, Apopka, FL 32703, USA
Cafe chain for health-minded breakfast, brunch & lunch options such as omelets, salads & soups.
1510 W Orange Blossom Trail, Apopka, FL 32712, USA
Source: Google Places. Names, addresses, photos and ratings are published by Google and can change.
Around here
Public parks inside this area's radius.
Administered by the local water board, this drive is open weekends & holidays for nature viewing.
2850 Lust Rd, Apopka, FL 32703, USA
WebsiteTennis & racquetball courts are offered at this 5-acre space with picnic areas, gazebo & playground.
10 N Forest Ave, Apopka, FL 32703, USA
WebsiteSource: Google Places. Names, addresses, photos and ratings are published by Google and can change.
Around here
Cinema, bowling, activities for the children, culture and sport around here, without repeating the parks. I list what actually exists, with the public Google rating where there is one.
Water park
Kit Land Nelson Park, 10 N Forest Ave, Apopka, FL 32703, USA
Artifacts from indigenous tribes & settlers are among the displays at this regional ethnography hub.
122 E 5th St, Apopka, FL 32703, USA
Gym
130 E 7th St, Apopka, FL 32703, USA
Source: Google Places. Names, addresses, photos and ratings are published by Google and can change.
Real indicators
These numbers are published per county, not per neighbourhood or community. They show the direction of the market around this area, they do not estimate the price of a specific home.
The midpoint asking price of homes listed across the whole county that month. It is what sellers ask, not what buyers pay, and a county is far larger than a single community, a specific neighbourhood can sit well above or below it.
$424,950
median asking price (USD)
−1.2% vs. a year earlier
September 2026 · monthly series
Median listing price (county): from $382,500 in September 2021 to $424,950 in September 2026, higher over the period. Low of $382,500 in September 2021 and high of $497,300 in July 2023. 61 real observations.
September 2021, September 2026 · 61 observations
Realtor.com via FRED · St. Louis FedShowing 1 in every 2 real observations from the selected period.
| Period | Median listing price |
|---|---|
| September 2021 | $382,500 |
| November 2021 | $386,000 |
| January 2022 | $389,990 |
| March 2022 | $416,750 |
| May 2022 | $462,000 |
| July 2022 | $484,945 |
| September 2022 | $465,448 |
| November 2022 | $448,950 |
| January 2023 | $434,900 |
| March 2023 | $447,000 |
| May 2023 | $474,950 |
| July 2023 | $497,300 |
| September 2023 | $480,000 |
| November 2023 | $465,500 |
| January 2024 | $436,850 |
| March 2024 | $439,900 |
| May 2024 | $450,000 |
| July 2024 | $455,000 |
| September 2024 | $447,861 |
| November 2024 | $436,490 |
| January 2025 | $422,450 |
| March 2025 | $419,000 |
| May 2025 | $444,900 |
| July 2025 | $441,250 |
| September 2025 | $430,000 |
| November 2025 | $430,000 |
| January 2026 | $425,000 |
| March 2026 | $430,000 |
| May 2026 | $437,990 |
| July 2026 | $439,450 |
| September 2026 | $424,950 |
Realtor.com via FRED · St. Louis Fed · Housing Inventory: Median Listing Price in Orange County, FL
Asking price divided by interior area, at the county midpoint. It travels better between areas than a total price because it partly removes house size from the comparison, but it still ignores lot, age, finish level and view.
$242
USD per square foot
−1.6% vs. a year earlier
September 2026 · monthly series
Median listing price per square foot (county): from $208 in September 2021 to $242 in September 2026, higher over the period. Low of $208 in September 2021 and high of $257 in September 2023. 61 real observations.
September 2021, September 2026 · 61 observations
Realtor.com via FRED · St. Louis FedShowing 1 in every 2 real observations from the selected period.
| Period | Price per sq ft |
|---|---|
| September 2021 | $208 |
| November 2021 | $212 |
| January 2022 | $220 |
| March 2022 | $234 |
| May 2022 | $249 |
| July 2022 | $249 |
| September 2022 | $245 |
| November 2022 | $242 |
| January 2023 | $243 |
| March 2023 | $248 |
| May 2023 | $251 |
| July 2023 | $255 |
| September 2023 | $257 |
| November 2023 | $255 |
| January 2024 | $252 |
| March 2024 | $254 |
| May 2024 | $255 |
| July 2024 | $256 |
| September 2024 | $252 |
| November 2024 | $249 |
| January 2025 | $247 |
| March 2025 | $246 |
| May 2025 | $249 |
| July 2025 | $247 |
| September 2025 | $246 |
| November 2025 | $245 |
| January 2026 | $243 |
| March 2026 | $245 |
| May 2026 | $244 |
| July 2026 | $244 |
| September 2026 | $242 |
Realtor.com via FRED · St. Louis Fed · Housing Inventory: Median Listing Price per Square Feet in Orange County, FL
How many homes were actively listed for sale in the county during the month: a snapshot of available supply. It says nothing about how many sold and excludes homes already under contract.
5,554
active listings
−0.9% vs. a year earlier
September 2026 · monthly series
Active listings (county): from 1,987 in September 2021 to 5,554 in September 2026, higher over the period. Low of 1,141 in February 2022 and high of 5,836 in June 2025. 61 real observations.
September 2021, September 2026 · 61 observations
Realtor.com via FRED · St. Louis FedShowing 1 in every 2 real observations from the selected period.
| Period | Active listings |
|---|---|
| September 2021 | 1,987 |
| November 2021 | 1,689 |
| January 2022 | 1,237 |
| March 2022 | 1,152 |
| May 2022 | 1,542 |
| July 2022 | 2,996 |
| September 2022 | 3,259 |
| November 2022 | 3,136 |
| January 2023 | 2,637 |
| March 2023 | 2,168 |
| May 2023 | 2,060 |
| July 2023 | 2,371 |
| September 2023 | 2,635 |
| November 2023 | 3,097 |
| January 2024 | 3,196 |
| March 2024 | 3,367 |
| May 2024 | 3,791 |
| July 2024 | 4,382 |
| September 2024 | 4,694 |
| November 2024 | 4,952 |
| January 2025 | 4,732 |
| March 2025 | 5,249 |
| May 2025 | 5,597 |
| July 2025 | 5,831 |
| September 2025 | 5,603 |
| November 2025 | 5,373 |
| January 2026 | 4,901 |
| March 2026 | 5,210 |
| May 2026 | 5,340 |
| July 2026 | 5,562 |
| September 2026 | 5,554 |
Realtor.com via FRED · St. Louis Fed · Housing Inventory: Active Listing Count in Orange County, FL
Homes that entered the county market for the first time that month. It measures how much new supply arrived, which is what usually changes negotiating room from one season to the next.
1,650
new listings in the month
+1.1% vs. a year earlier
September 2026 · monthly series
New listings (county): from 2,002 in September 2021 to 1,650 in September 2026, lower over the period. Low of 1,140 in December 2022 and high of 2,440 in June 2022. 61 real observations.
September 2021, September 2026 · 61 observations
Realtor.com via FRED · St. Louis FedShowing 1 in every 2 real observations from the selected period.
| Period | New listings |
|---|---|
| September 2021 | 2,002 |
| November 2021 | 1,678 |
| January 2022 | 1,560 |
| March 2022 | 1,972 |
| May 2022 | 2,278 |
| July 2022 | 2,344 |
| September 2022 | 1,852 |
| November 2022 | 1,288 |
| January 2023 | 1,454 |
| March 2023 | 1,528 |
| May 2023 | 1,684 |
| July 2023 | 1,644 |
| September 2023 | 1,664 |
| November 2023 | 1,432 |
| January 2024 | 1,626 |
| March 2024 | 1,876 |
| May 2024 | 2,020 |
| July 2024 | 1,816 |
| September 2024 | 1,604 |
| November 2024 | 1,548 |
| January 2025 | 1,810 |
| March 2025 | 1,992 |
| May 2025 | 1,896 |
| July 2025 | 1,828 |
| September 2025 | 1,632 |
| November 2025 | 1,528 |
| January 2026 | 1,772 |
| March 2026 | 1,946 |
| May 2026 | 2,052 |
| July 2026 | 1,732 |
| September 2026 | 1,650 |
Realtor.com via FRED · St. Louis Fed · Housing Inventory: New Listing Count in Orange County, FL
The midpoint of how long county listings stayed on the market that month: half were listed for less, half for more. It measures pace, not price.
73
days on market
−3.9% vs. a year earlier
September 2026 · monthly series
Median days on market (county): from 38 in September 2021 to 73 in September 2026, higher over the period. Low of 27 in June 2022 and high of 86 in January 2026. 61 real observations.
September 2021, September 2026 · 61 observations
Realtor.com via FRED · St. Louis FedShowing 1 in every 2 real observations from the selected period.
| Period | Days on market |
|---|---|
| September 2021 | 38 |
| November 2021 | 42 |
| January 2022 | 42 |
| March 2022 | 31 |
| May 2022 | 28 |
| July 2022 | 30 |
| September 2022 | 47 |
| November 2022 | 63 |
| January 2023 | 71 |
| March 2023 | 50 |
| May 2023 | 43 |
| July 2023 | 42 |
| September 2023 | 45 |
| November 2023 | 49 |
| January 2024 | 60 |
| March 2024 | 47 |
| May 2024 | 48 |
| July 2024 | 55 |
| September 2024 | 62 |
| November 2024 | 70 |
| January 2025 | 76 |
| March 2025 | 57 |
| May 2025 | 60 |
| July 2025 | 70 |
| September 2025 | 76 |
| November 2025 | 78 |
| January 2026 | 86 |
| March 2026 | 64 |
| May 2026 | 65 |
| July 2026 | 69 |
| September 2026 | 73 |
Realtor.com via FRED · St. Louis Fed · Housing Inventory: Median Days on Market in Orange County, FL
Median listing price
$410,000
median asking price (USD)
−2.5% vs. a year earlier
September 2026 · monthly series
Florida house price index
825.7
index · base 1980:Q1 = 100
+1.4% vs. a year earlier
Q2 2026 · quarterly series
30-year fixed mortgage rate
7.24%
annual rate
+1.07 percentage points vs. a year earlier
Week ending Oct 29, 2026 · weekly average
Honest trade-offs
Trade-offs
Compare
A master-planned area in southeast Orlando organized around health, education, technology and an unusually connected network of trails and parks.
OpenA city west of Orlando with a genuine historic downtown, wrapped by newer residential communities built over the last two decades.
OpenA low-density, lake-oriented area on the Butler Chain of Lakes, known for large lots, mature oaks and privacy.
OpenNext step
Goals, budget, timing and the regions that fit you, with no obligation.