
Identity
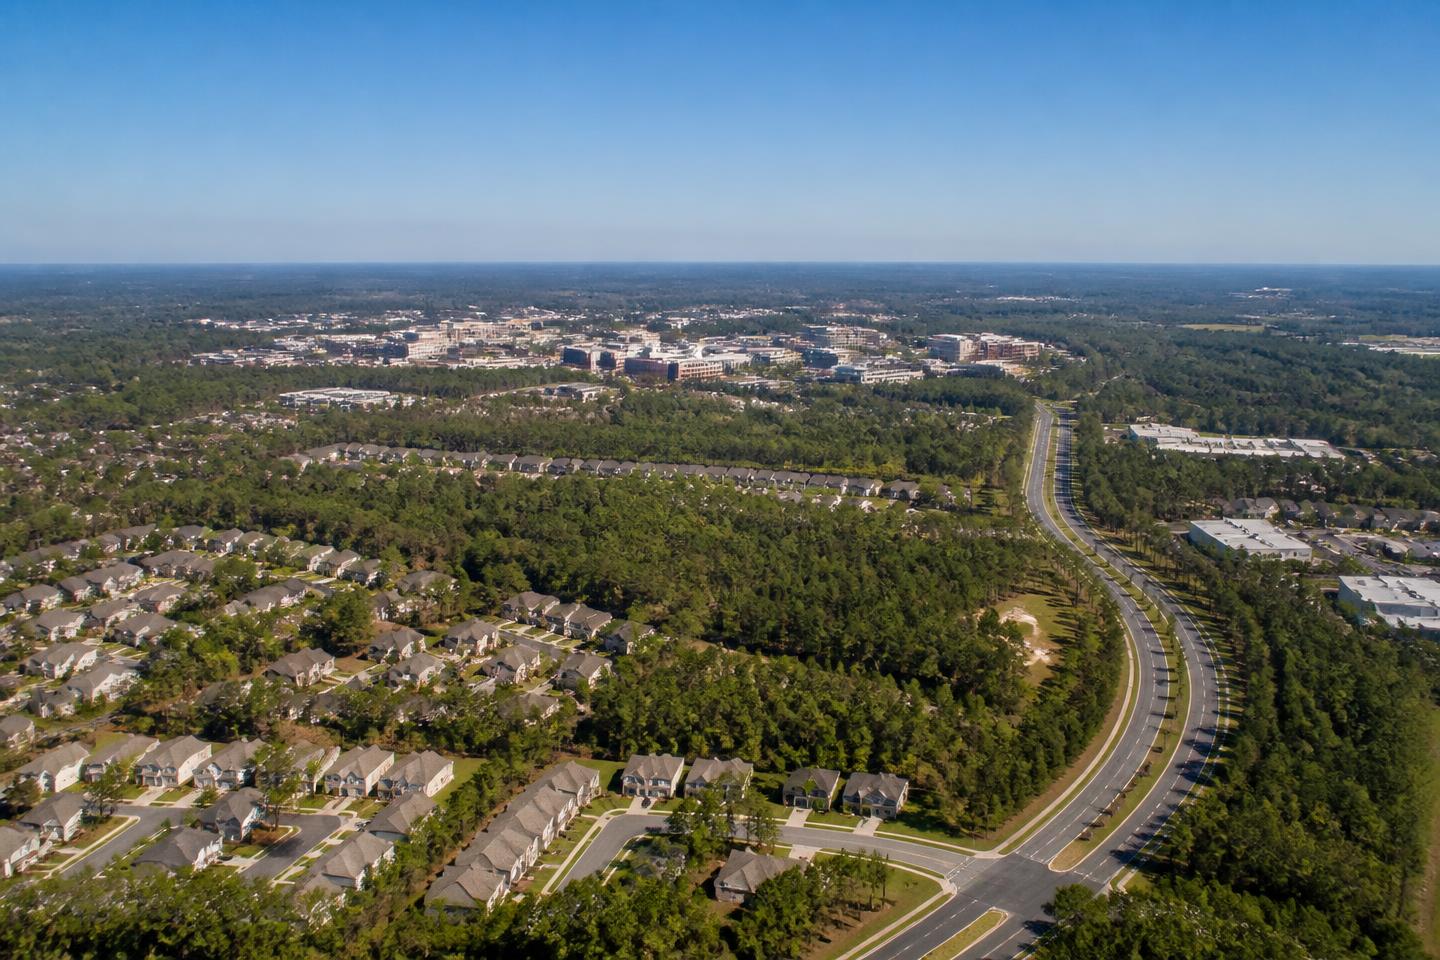
Alafaya is defined by the university and the research park beside it. That produces two overlapping markets in the same territory: family subdivisions built from the 1980s onward, and purpose-built rental product close to campus.
Orange County
Greater OrlandoFlorida
The large residential area around the University of Florida corridor in east Orlando, mixing established subdivisions with student housing.
Talk to DaniAlafaya is defined by the university and the research park beside it. That produces two overlapping markets in the same territory: family subdivisions built from the 1980s onward, and purpose-built rental product close to campus.
East Orange County along Alafaya Trail, between SR-408 and SR-50.
In practice, here is the rhythm you will find: retail and services line Alafaya Trail and University Boulevard; residential streets sit immediately behind them.
mostly infill and redevelopment along the corridors; large new subdivisions are limited by available land.
Plan on this for getting around: car-based, with SR-408 the main route west and heavy corridor traffic during term time.
The area
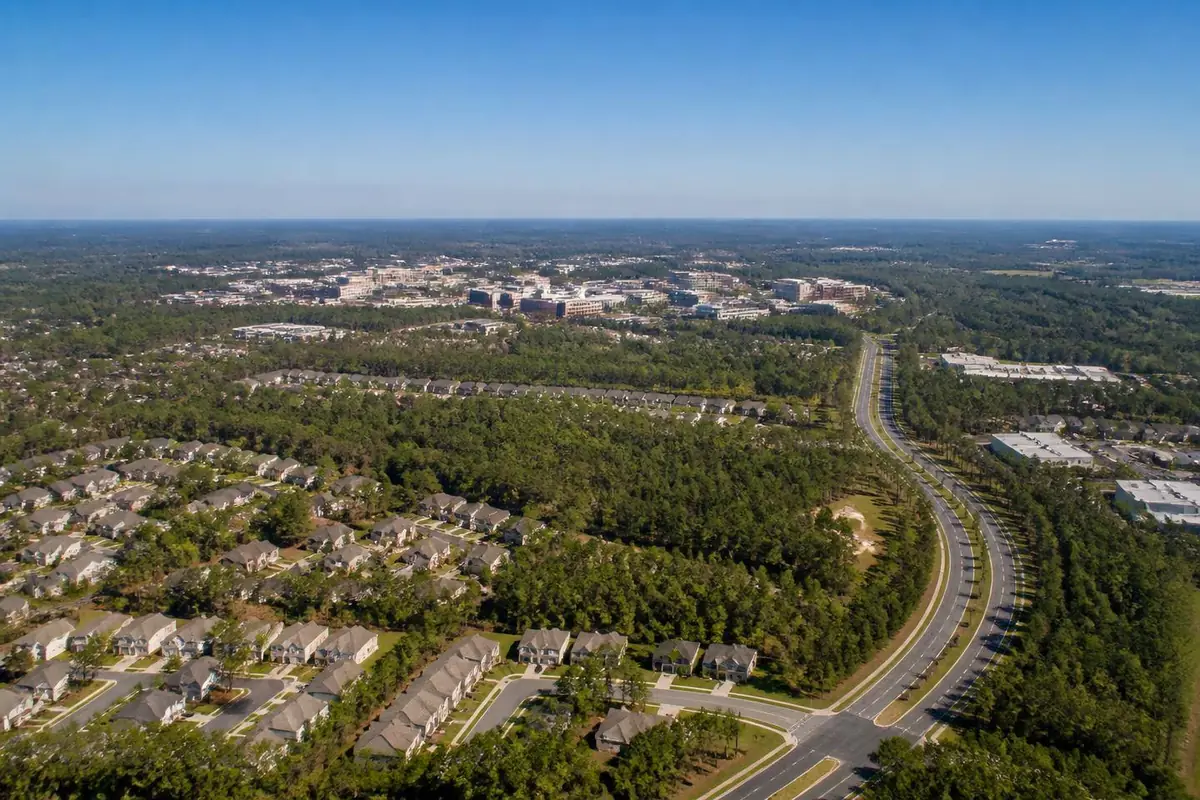
A university corridor of research campuses and quiet residential streets.
Real life here
The academic calendar sets the tempo: heavier traffic and fuller restaurants during term time along Alafaya Trail and University Boulevard, quieter streets during breaks. Established subdivisions behind the corridor keep their own steadier routine of school runs and errands regardless of the university's schedule.
Alafaya Trail and University Boulevard carry a dense strip of casual and quick-service dining aimed at student volume, with Waterford Lakes Town Center a short drive away for a broader sit-down selection.
Groceries, pharmacies and clinics line both main corridors; Waterford Lakes Town Center adds larger retail, and hospitals are reached via SR-408 toward downtown or east Orlando.
Traffic and rental turnover both track the academic calendar closely, with move-in and move-out periods being the busiest weeks of the year on the corridor.
Around here
Real institutions inside this area's radius, ordered by distance. No ratings: assignment depends on the exact address, and a star average does not measure a school.
School serving this area
12351 Research Pkwy, Orlando, FL 32826, USA
WebsiteSource: Google Places. Names, addresses, photos and ratings are published by Google and can change.
Around here
Real addresses nearby, with public Google ratings where they exist.
Mexican restaurant
12789 Waterford Lakes Pkwy bay 13, Orlando, FL 32828, USA
Chefs put on a show at this Japanese chain offering hibachi items, traditional dishes & sushi.
11609 E Colonial Dr, Orlando, FL 32817, USA
Expansive operation offering American-style pub grub, plus ax throwing, karaoke & darts facilities.
12850 Waterford Lakes Pkwy, Orlando, FL 32828, USA
Upscale chain serving New American fare paired with house-label wines in a contemporary setting.
529 N Alafaya Trail, Orlando, FL 32828, USA
Restaurant
12140 Collegiate Way 175 #170#165, Orlando, FL 32817, USA
Amusement center
610 N Alafaya Trail, Orlando, FL 32828, USA
Bowling center with an arcade plus a sports bar hosting comedy nights.
10749 E Colonial Dr, Orlando, FL 32817, USA
Source: Google Places. Names, addresses, photos and ratings are published by Google and can change.
Around here
Public parks inside this area's radius.
84-acre park with trails, river, canoeing, fishing & picnic tables plus courts & fields for sports.
2451 Dean Rd, Union Park, FL 32817, USA
WebsiteA 47-acre park with splash playground, baseball complex, picnicking, lake, sand volleyball & more.
10107 Flowers Ave, Orlando, FL 32825, USA
WebsitePark
Little Econ Greenway, Union Park, FL 32817, USA
This large, shallow pool with a fountain is an aquatic focal point at University of Central Florida.
Orlando, FL 32816, USA
WebsiteSource: Google Places. Names, addresses, photos and ratings are published by Google and can change.
Around here
Cinema, bowling, activities for the children, culture and sport around here, without repeating the parks. I list what actually exists, with the public Google rating where there is one.
Amusement center
570 N Alafaya Trail Ste 109-110, Orlando, FL 32828, USA
Expansive operation offering American-style pub grub, plus ax throwing, karaoke & darts facilities.
12850 Waterford Lakes Pkwy, Orlando, FL 32828, USA
Adventure-themed mini-golf course with waterfalls, gator feedings, scavenger hunts & arcade games.
12193 E Colonial Dr, Orlando, FL 32826, USA
Bowling center with an arcade plus a sports bar hosting comedy nights.
10749 E Colonial Dr, Orlando, FL 32817, USA
Sports activity location
4000 Central Florida Blvd, Orlando, FL 32816, USA
Fitness center
11849 E Colonial Dr, Orlando, FL 32826, USA
Theater complex with multiple screens featuring new release films, plush seating & concession stand.
541 N Alafaya Trail, Orlando, FL 32828, USA
Source: Google Places. Names, addresses, photos and ratings are published by Google and can change.
Real indicators
These numbers are published per county, not per neighbourhood or community. They show the direction of the market around this area, they do not estimate the price of a specific home.
The midpoint asking price of homes listed across the whole county that month. It is what sellers ask, not what buyers pay, and a county is far larger than a single community, a specific neighbourhood can sit well above or below it.
$430,000
median asking price (USD)
−0.9% vs. a year earlier
August 2026 · monthly series
Median listing price (county): from $380,026 in August 2021 to $430,000 in August 2026, higher over the period. Low of $380,026 in August 2021 and high of $497,300 in July 2023. 61 real observations.
August 2021, August 2026 · 61 observations
Realtor.com via FRED · St. Louis FedShowing 1 in every 2 real observations from the selected period.
| Period | Median listing price |
|---|---|
| August 2021 | $380,026 |
| October 2021 | $393,715 |
| December 2021 | $385,495 |
| February 2022 | $395,475 |
| April 2022 | $429,900 |
| June 2022 | $485,000 |
| August 2022 | $477,000 |
| October 2022 | $456,495 |
| December 2022 | $440,000 |
| February 2023 | $437,475 |
| April 2023 | $464,000 |
| June 2023 | $495,000 |
| August 2023 | $487,500 |
| October 2023 | $474,999 |
| December 2023 | $445,000 |
| February 2024 | $439,248 |
| April 2024 | $445,875 |
| June 2024 | $455,000 |
| August 2024 | $454,900 |
| October 2024 | $439,950 |
| December 2024 | $425,473 |
| February 2025 | $422,450 |
| April 2025 | $430,000 |
| June 2025 | $445,000 |
| August 2025 | $433,990 |
| October 2025 | $429,950 |
| December 2025 | $428,625 |
| February 2026 | $427,000 |
| April 2026 | $435,000 |
| June 2026 | $443,995 |
| August 2026 | $430,000 |
Realtor.com via FRED · St. Louis Fed · Housing Inventory: Median Listing Price in Orange County, FL
Asking price divided by interior area, at the county midpoint. It travels better between areas than a total price because it partly removes house size from the comparison, but it still ignores lot, age, finish level and view.
$242
USD per square foot
−1.6% vs. a year earlier
August 2026 · monthly series
Median listing price per square foot (county): from $207 in August 2021 to $242 in August 2026, higher over the period. Low of $207 in August 2021 and high of $257 in September 2023. 61 real observations.
August 2021, August 2026 · 61 observations
Realtor.com via FRED · St. Louis FedShowing 1 in every 2 real observations from the selected period.
| Period | Price per sq ft |
|---|---|
| August 2021 | $207 |
| October 2021 | $209 |
| December 2021 | $215 |
| February 2022 | $225 |
| April 2022 | $244 |
| June 2022 | $250 |
| August 2022 | $248 |
| October 2022 | $245 |
| December 2022 | $241 |
| February 2023 | $244 |
| April 2023 | $250 |
| June 2023 | $255 |
| August 2023 | $255 |
| October 2023 | $257 |
| December 2023 | $254 |
| February 2024 | $253 |
| April 2024 | $254 |
| June 2024 | $256 |
| August 2024 | $254 |
| October 2024 | $251 |
| December 2024 | $249 |
| February 2025 | $246 |
| April 2025 | $249 |
| June 2025 | $248 |
| August 2025 | $246 |
| October 2025 | $246 |
| December 2025 | $243 |
| February 2026 | $243 |
| April 2026 | $243 |
| June 2026 | $245 |
| August 2026 | $242 |
Realtor.com via FRED · St. Louis Fed · Housing Inventory: Median Listing Price per Square Feet in Orange County, FL
How many homes were actively listed for sale in the county during the month: a snapshot of available supply. It says nothing about how many sold and excludes homes already under contract.
5,577
active listings
−2.7% vs. a year earlier
August 2026 · monthly series
Active listings (county): from 2,057 in August 2021 to 5,577 in August 2026, higher over the period. Low of 1,141 in February 2022 and high of 5,836 in June 2025. 61 real observations.
August 2021, August 2026 · 61 observations
Realtor.com via FRED · St. Louis FedShowing 1 in every 2 real observations from the selected period.
| Period | Active listings |
|---|---|
| August 2021 | 2,057 |
| October 2021 | 1,866 |
| December 2021 | 1,454 |
| February 2022 | 1,141 |
| April 2022 | 1,228 |
| June 2022 | 2,089 |
| August 2022 | 3,221 |
| October 2022 | 3,097 |
| December 2022 | 2,865 |
| February 2023 | 2,379 |
| April 2023 | 2,086 |
| June 2023 | 2,189 |
| August 2023 | 2,474 |
| October 2023 | 2,878 |
| December 2023 | 3,145 |
| February 2024 | 3,266 |
| April 2024 | 3,590 |
| June 2024 | 4,096 |
| August 2024 | 4,611 |
| October 2024 | 4,819 |
| December 2024 | 4,717 |
| February 2025 | 4,978 |
| April 2025 | 5,442 |
| June 2025 | 5,836 |
| August 2025 | 5,731 |
| October 2025 | 5,532 |
| December 2025 | 5,188 |
| February 2026 | 5,044 |
| April 2026 | 5,233 |
| June 2026 | 5,474 |
| August 2026 | 5,577 |
Realtor.com via FRED · St. Louis Fed · Housing Inventory: Active Listing Count in Orange County, FL
Homes that entered the county market for the first time that month. It measures how much new supply arrived, which is what usually changes negotiating room from one season to the next.
1,760
new listings in the month
+9.2% vs. a year earlier
August 2026 · monthly series
New listings (county): from 2,186 in August 2021 to 1,760 in August 2026, lower over the period. Low of 1,140 in December 2022 and high of 2,440 in June 2022. 61 real observations.
August 2021, August 2026 · 61 observations
Realtor.com via FRED · St. Louis FedShowing 1 in every 2 real observations from the selected period.
| Period | New listings |
|---|---|
| August 2021 | 2,186 |
| October 2021 | 1,836 |
| December 2021 | 1,544 |
| February 2022 | 1,864 |
| April 2022 | 1,996 |
| June 2022 | 2,440 |
| August 2022 | 2,008 |
| October 2022 | 1,492 |
| December 2022 | 1,140 |
| February 2023 | 1,524 |
| April 2023 | 1,584 |
| June 2023 | 1,740 |
| August 2023 | 1,634 |
| October 2023 | 1,526 |
| December 2023 | 1,376 |
| February 2024 | 1,770 |
| April 2024 | 1,958 |
| June 2024 | 1,936 |
| August 2024 | 1,768 |
| October 2024 | 1,724 |
| December 2024 | 1,250 |
| February 2025 | 2,060 |
| April 2025 | 2,106 |
| June 2025 | 2,046 |
| August 2025 | 1,612 |
| October 2025 | 1,608 |
| December 2025 | 1,178 |
| February 2026 | 1,844 |
| April 2026 | 1,954 |
| June 2026 | 2,004 |
| August 2026 | 1,760 |
Realtor.com via FRED · St. Louis Fed · Housing Inventory: New Listing Count in Orange County, FL
The midpoint of how long county listings stayed on the market that month: half were listed for less, half for more. It measures pace, not price.
71
days on market
−1.4% vs. a year earlier
August 2026 · monthly series
Median days on market (county): from 36 in August 2021 to 71 in August 2026, higher over the period. Low of 27 in June 2022 and high of 86 in January 2026. 61 real observations.
August 2021, August 2026 · 61 observations
Realtor.com via FRED · St. Louis FedShowing 1 in every 2 real observations from the selected period.
| Period | Days on market |
|---|---|
| August 2021 | 36 |
| October 2021 | 41 |
| December 2021 | 56 |
| February 2022 | 32 |
| April 2022 | 31 |
| June 2022 | 27 |
| August 2022 | 39 |
| October 2022 | 57 |
| December 2022 | 66 |
| February 2023 | 58 |
| April 2023 | 47 |
| June 2023 | 41 |
| August 2023 | 43 |
| October 2023 | 45 |
| December 2023 | 54 |
| February 2024 | 53 |
| April 2024 | 47 |
| June 2024 | 51 |
| August 2024 | 58 |
| October 2024 | 66 |
| December 2024 | 77 |
| February 2025 | 68 |
| April 2025 | 58 |
| June 2025 | 65 |
| August 2025 | 72 |
| October 2025 | 78 |
| December 2025 | 80 |
| February 2026 | 78 |
| April 2026 | 64 |
| June 2026 | 66 |
| August 2026 | 71 |
Realtor.com via FRED · St. Louis Fed · Housing Inventory: Median Days on Market in Orange County, FL
Median listing price
$415,000
median asking price (USD)
−1.9% vs. a year earlier
August 2026 · monthly series
Florida house price index
825.7
index · base 1980:Q1 = 100
+1.4% vs. a year earlier
Q2 2026 · quarterly series
30-year fixed mortgage rate
6.76%
annual rate
+0.41 percentage points vs. a year earlier
Week ending Sep 10, 2026 · weekly average
Honest trade-offs
Trade-offs
Compare
A master-planned area in southeast Orlando organized around health, education, technology and an unusually connected network of trails and parks.
OpenA city west of Orlando with a genuine historic downtown, wrapped by newer residential communities built over the last two decades.
OpenA low-density, lake-oriented area on the Butler Chain of Lakes, known for large lots, mature oaks and privacy.
OpenNext step
Goals, budget, timing and the regions that fit you, with no obligation.