
Dani Kubrusly

Sumter / Lake / Marion

The Villages Area

Greater OrlandoCentral Florida

The large age-restricted community north of Lake County, organised around golf, town squares and a network of golf-cart roads.

Talk to Dani

Identity

The Villages is a purpose-built retirement community at a scale that behaves like a city: its own commercial squares, recreation centres, medical infrastructure and a separate road network for golf carts. Occupancy rules are age-restricted and enforced.
Location and access

North of Leesburg across Sumter, Lake and Marion counties, on US-27-441 and the Turnpike corridor.

Everyday life

Recreation-driven: golf, clubs, town-square entertainment and cart travel between amenities.

  • The town squares, with nightly entertainment.
  • Executive and championship golf courses.
  • Recreation centres and the cart-path network.

Housing

  • Villas, patio homes and designer homes.
  • Premier homes on larger lots.
  • Amenity and bond structures attached to properties.

New construction

Continuous southward expansion into new villages with their own squares and amenities.

Getting around

Golf carts inside the community, car outside; the Turnpike serves regional trips.

The Villages Area, Central Florida

The area

Golf-cart lanes and town squares stretching across three counties of rolling hills.

Real life here

What an ordinary week looks like.

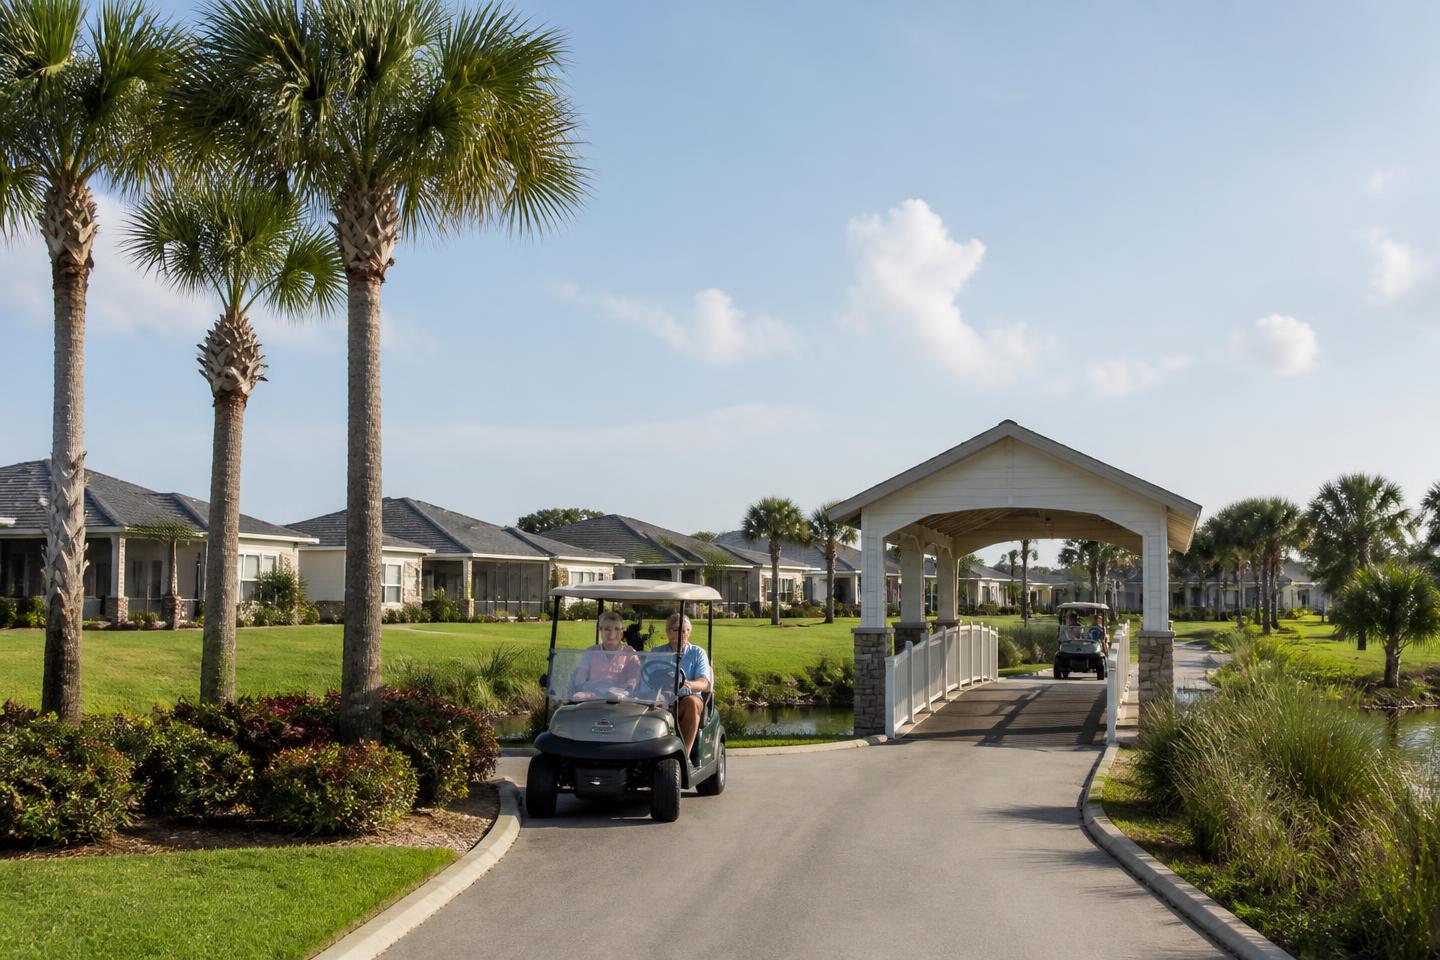
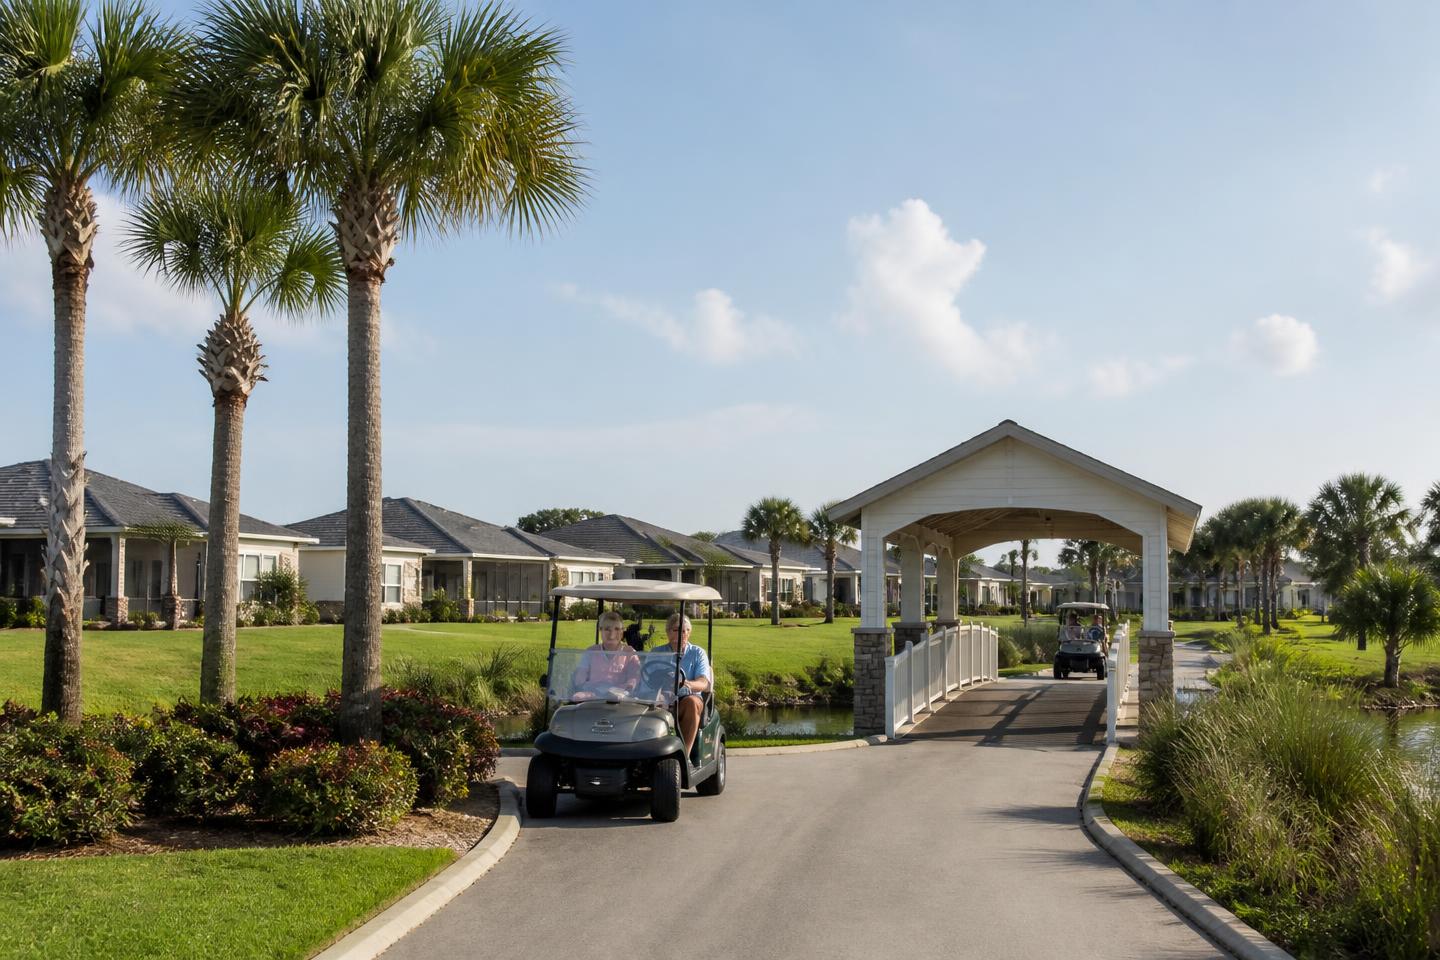
Life is organised around recreation rather than a commute: golf in the morning, a golf cart to Spanish Springs or Sumter Landing town square for lunch and errands, and live entertainment on the squares most evenings. A separate network of golf-cart paths and bridges connects the villages without needing a car for most daily trips.

Routines that fit

  • Meeting the community's age-restricted occupancy rules.
  • Playing golf frequently across a large network of courses.
  • Running daily errands by golf cart rather than by car.
  • Accepting bond and amenity fees attached to the property as part of the arrangement.

Outdoors and leisure

  • Executive and championship golf courses distributed throughout the community.
  • Spanish Springs and Sumter Landing town squares, with nightly entertainment.
  • Golf-cart bridges and paths linking villages without crossing main roads.
  • Recreation centres with pools, courts and fitness classes across the villages.

Eating and shopping

The town squares — Spanish Springs, Sumter Landing and others added as the community expands — carry most restaurants and casual dining, reachable by golf cart from most homes; larger supermarkets sit on the surrounding highway corridor.

The community includes its own medical facilities, banks, pharmacies and shopping across the squares; because the area spans Sumter, Lake and Marion counties, which specific services and jurisdictions apply depends on the exact address.

Seasons

Activity is heaviest in the cooler months when the population swells with seasonal residents; expansion of new villages, squares and roads is ongoing, so the immediate surroundings of a given address can keep changing for years.

Real indicators

Market in Sumter County, with sources.

These numbers are published per county, not per neighbourhood or community. They show the direction of the market around this area — they do not estimate the price of a specific home.

Median listing price (county)

The midpoint asking price of homes listed across the whole county that month. It is what sellers ask, not what buyers pay, and a county is far larger than a single community — a specific neighbourhood can sit well above or below it.

$370,000

median asking price (USD)

−0.5% vs. a year earlier

August 2026 · monthly series

Median listing price (county) · Sumter County, FL

Median listing price (county): from $362,475 in August 2021 to $370,000 in August 2026 — higher over the period. Low of $359,900 in October 2021 and high of $429,975 in March 2022. 61 real observations.

August 2021August 2026 · 61 observations

Realtor.com via FRED · St. Louis Fed
View data table

Showing 1 in every 2 real observations from the selected period.

Median listing price (county)
PeriodMedian listing price
August 2021$362,475
October 2021$359,900
December 2021$383,725
February 2022$410,000
April 2022$429,900
June 2022$424,925
August 2022$416,950
October 2022$405,000
December 2022$407,500
February 2023$419,950
April 2023$399,900
June 2023$397,450
August 2023$401,192
October 2023$399,900
December 2023$390,000
February 2024$392,000
April 2024$385,800
June 2024$374,620
August 2024$374,710
October 2024$392,450
December 2024$385,000
February 2025$377,450
April 2025$374,574
June 2025$374,925
August 2025$371,900
October 2025$369,687
December 2025$363,902
February 2026$380,375
April 2026$374,450
June 2026$374,950
August 2026$370,000

Realtor.com via FRED · St. Louis Fed · Housing Inventory: Median Listing Price in Sumter County, FL

Median listing price per square foot (county)

Asking price divided by interior area, at the county midpoint. It travels better between areas than a total price because it partly removes house size from the comparison — but it still ignores lot, age, finish level and view.

$250

USD per square foot

+1.6% vs. a year earlier

August 2026 · monthly series

Median listing price per square foot (county) · Sumter County, FL

Median listing price per square foot (county): from $218 in August 2021 to $250 in August 2026 — higher over the period. Low of $218 in August 2021 and high of $273 in April 2022. 61 real observations.

August 2021August 2026 · 61 observations

Realtor.com via FRED · St. Louis Fed
View data table

Showing 1 in every 2 real observations from the selected period.

Median listing price per square foot (county)
PeriodPrice per sq ft
August 2021$218
October 2021$219
December 2021$232
February 2022$253
April 2022$273
June 2022$271
August 2022$264
October 2022$258
December 2022$259
February 2023$261
April 2023$259
June 2023$258
August 2023$259
October 2023$260
December 2023$258
February 2024$257
April 2024$255
June 2024$254
August 2024$249
October 2024$251
December 2024$252
February 2025$250
April 2025$251
June 2025$247
August 2025$246
October 2025$248
December 2025$248
February 2026$247
April 2026$246
June 2026$247
August 2026$250

Realtor.com via FRED · St. Louis Fed · Housing Inventory: Median Listing Price per Square Feet in Sumter County, FL

Active listings (county)

How many homes were actively listed for sale in the county during the month: a snapshot of available supply. It says nothing about how many sold and excludes homes already under contract.

584

active listings

−11.8% vs. a year earlier

August 2026 · monthly series

Active listings (county) · Sumter County, FL

Active listings (county): from 155 in August 2021 to 584 in August 2026 — higher over the period. Low of 141 in January 2022 and high of 764 in May 2025. 61 real observations.

August 2021August 2026 · 61 observations

Realtor.com via FRED · St. Louis Fed
View data table

Showing 1 in every 2 real observations from the selected period.

Active listings (county)
PeriodActive listings
August 2021155
October 2021177
December 2021154
February 2022142
April 2022174
June 2022271
August 2022320
October 2022378
December 2022409
February 2023397
April 2023416
June 2023427
August 2023384
October 2023393
December 2023436
February 2024466
April 2024485
June 2024569
August 2024616
October 2024647
December 2024625
February 2025696
April 2025763
June 2025695
August 2025662
October 2025627
December 2025599
February 2026652
April 2026639
June 2026617
August 2026584

Realtor.com via FRED · St. Louis Fed · Housing Inventory: Active Listing Count in Sumter County, FL

New listings (county)

Homes that entered the county market for the first time that month. It measures how much new supply arrived, which is what usually changes negotiating room from one season to the next.

228

new listings in the month

+3.6% vs. a year earlier

August 2026 · monthly series

New listings (county) · Sumter County, FL

New listings (county): from 174 in August 2021 to 228 in August 2026 — higher over the period. Low of 112 in December 2022 and high of 288 in March 2025. 61 real observations.

August 2021August 2026 · 61 observations

Realtor.com via FRED · St. Louis Fed
View data table

Showing 1 in every 2 real observations from the selected period.

New listings (county)
PeriodNew listings
August 2021174
October 2021180
December 2021146
February 2022194
April 2022192
June 2022228
August 2022154
October 2022160
December 2022112
February 2023182
April 2023216
June 2023196
August 2023176
October 2023192
December 2023136
February 2024210
April 2024232
June 2024220
August 2024240
October 2024232
December 2024204
February 2025278
April 2025252
June 2025194
August 2025220
October 2025190
December 2025170
February 2026246
April 2026264
June 2026218
August 2026228

Realtor.com via FRED · St. Louis Fed · Housing Inventory: New Listing Count in Sumter County, FL

Median days on market (county)

The midpoint of how long county listings stayed on the market that month: half were listed for less, half for more. It measures pace, not price.

67

days on market

−5.6% vs. a year earlier

August 2026 · monthly series

Median days on market (county) · Sumter County, FL

Median days on market (county): from 40 in August 2021 to 67 in August 2026 — higher over the period. Low of 30 in May 2022 and high of 73 in November 2025. 61 real observations.

August 2021August 2026 · 61 observations

Realtor.com via FRED · St. Louis Fed
View data table

Showing 1 in every 2 real observations from the selected period.

Median days on market (county)
PeriodDays on market
August 202140
October 202139
December 202157
February 202235
April 202233
June 202230
August 202241
October 202252
December 202260
February 202365
April 202345
June 202344
August 202362
October 202356
December 202356
February 202455
April 202450
June 202452
August 202458
October 202463
December 202469
February 202559
April 202558
June 202571
August 202571
October 202570
December 202573
February 202658
April 202660
June 202662
August 202667

Realtor.com via FRED · St. Louis Fed · Housing Inventory: Median Days on Market in Sumter County, FL

Metro and statewide context

Median listing price

$415,000

median asking price (USD)

−1.9% vs. a year earlier

August 2026 · monthly series

Florida house price index

825.7

index · base 1980:Q1 = 100

+1.4% vs. a year earlier

Q2 2026 · quarterly series

30-year fixed mortgage rate

6.71%

annual rate

+0.21 percentage points vs. a year earlier

Week ending Sep 03, 2026 · weekly average

Honest trade-offs

What you accept when you choose this area.

Trade-offs

  • Age restrictions determine who may occupy a home.
  • Bond and amenity obligations vary by property.
  • Distance from Orlando and its airports is significant.

Next step

A thirty-minute conversation.

Goals, budget, timing and the regions that fit you — with no obligation.

Talk to Dani