
Identity
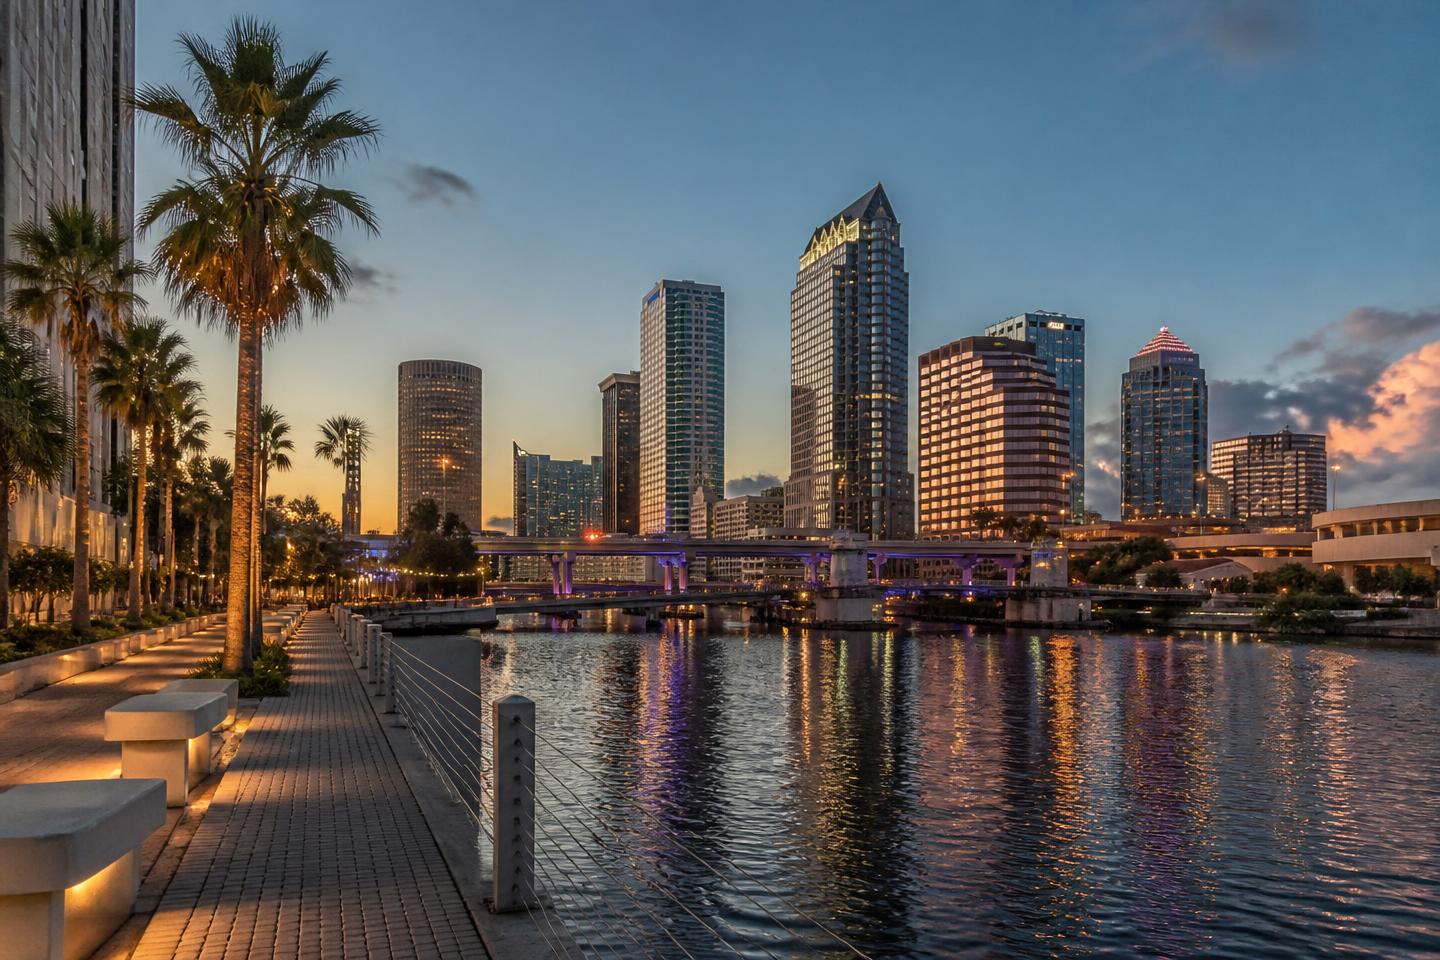
Tampa is a full metro of its own: a port, a financial and healthcare employment base, professional sports, and neighbourhoods that range from nineteenth-century brick districts to waterfront suburbs.
Hillsborough County
Greater OrlandoCentral Florida
The largest city on Florida's Gulf side, with a downtown riverwalk, historic Ybor City and a broad range of urban and suburban neighbourhoods.
Talk to DaniTampa is a full metro of its own: a port, a financial and healthcare employment base, professional sports, and neighbourhoods that range from nineteenth-century brick districts to waterfront suburbs.
Hillsborough County on Tampa Bay, about ninety minutes west of Orlando on I-4.
Urban: walkable districts, a riverwalk, streetcar service in the core and full-scale city services.
Significant vertical development downtown, plus large suburban growth in the surrounding county.
Car-based overall, with a walkable core, streetcar and a major international airport.
The area
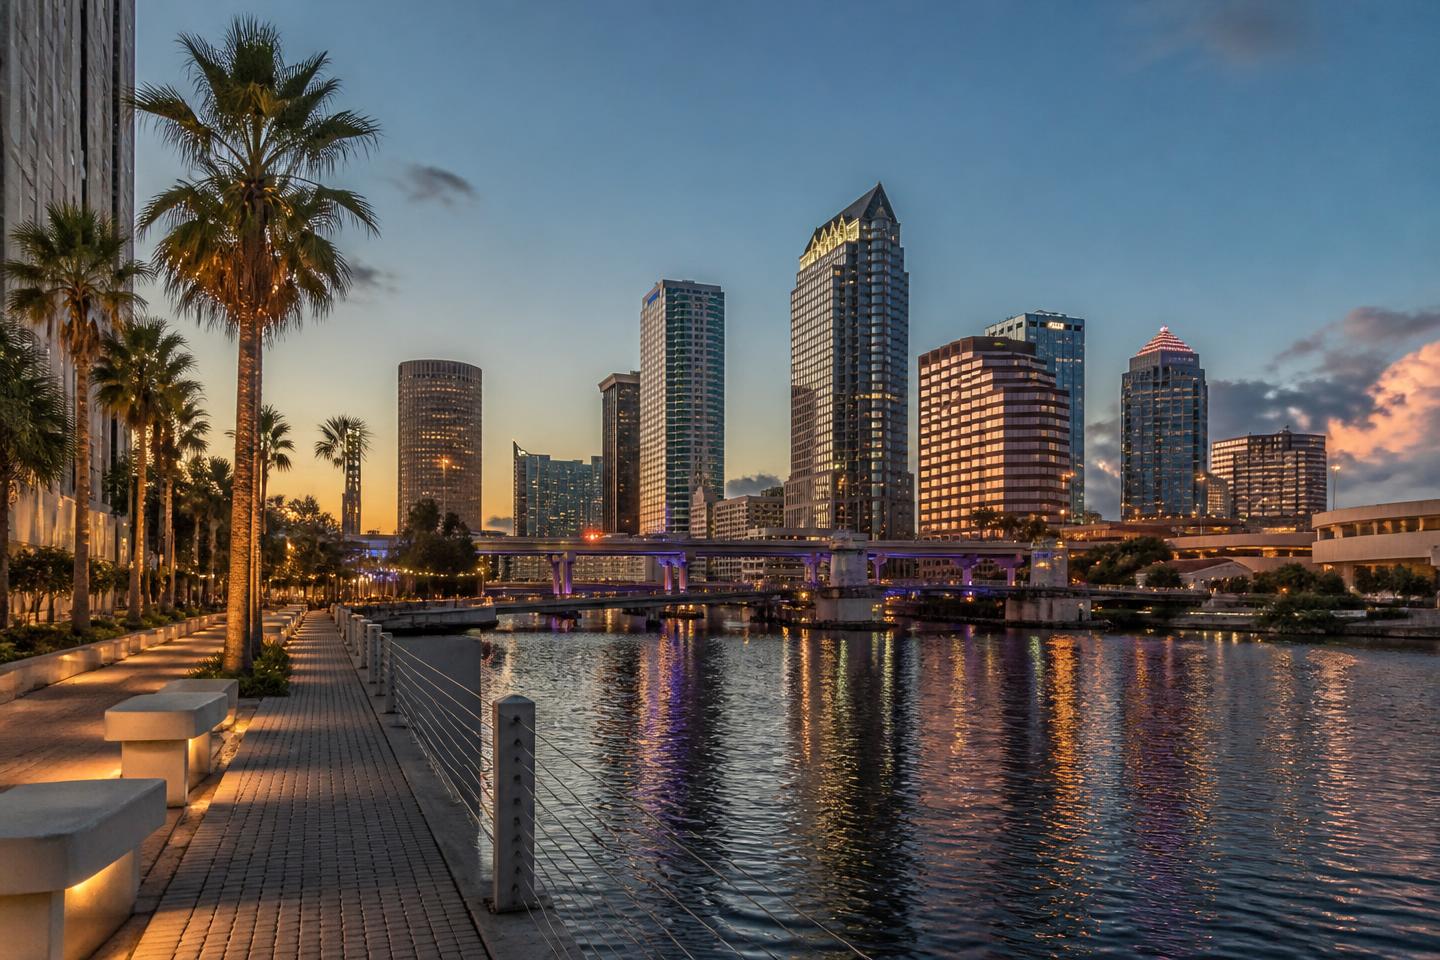
A riverfront skyline linking a historic cigar district to the bay channel.
Real life here
Tampa runs like a full metro: commutes into downtown or Water Street, lunch and after-work stops on the Riverwalk, and weekends that split between Bayshore Boulevard for walking or biking and Ybor City for dinner and nightlife. Neighborhoods further out — Hyde Park, Seminole Heights, the suburbs — each keep their own smaller commercial center.
Downtown and Water Street cover business dining and newer openings; Ybor City holds the historic restaurant and nightlife district; Hyde Park and Seminole Heights each carry their own independent restaurant scenes. As a full metro, Tampa's range runs from long-established Cuban and Spanish restaurants to newer concepts, without a single defined strip.
As the largest city on this coast, Tampa has full-scale hospitals, specialist medical networks and every category of retail, spread across downtown and the surrounding commercial corridors rather than concentrated in one place.
Hurricane season runs June through November, and exposure varies sharply by elevation and distance from Tampa Bay — downtown, Bayshore Boulevard and low-lying waterfront neighborhoods carry more storm-surge risk than inland suburbs, which affects flood insurance requirements block by block. Summer brings near-daily afternoon storms; the cooler months bring both the most comfortable weather and the heaviest visitor and event traffic.
Real indicators
These numbers are published per county, not per neighbourhood or community. They show the direction of the market around this area — they do not estimate the price of a specific home.
The midpoint asking price of homes listed across the whole county that month. It is what sellers ask, not what buyers pay, and a county is far larger than a single community — a specific neighbourhood can sit well above or below it.
$415,000
median asking price (USD)
−6.7% vs. a year earlier
August 2026 · monthly series
Median listing price (county): from $377,250 in August 2021 to $415,000 in August 2026 — higher over the period. Low of $377,250 in August 2021 and high of $477,575 in June 2023. 61 real observations.
August 2021 — August 2026 · 61 observations
Realtor.com via FRED · St. Louis FedShowing 1 in every 2 real observations from the selected period.
| Period | Median listing price |
|---|---|
| August 2021 | $377,250 |
| October 2021 | $390,000 |
| December 2021 | $397,000 |
| February 2022 | $420,560 |
| April 2022 | $438,990 |
| June 2022 | $461,460 |
| August 2022 | $450,000 |
| October 2022 | $449,000 |
| December 2022 | $429,850 |
| February 2023 | $425,000 |
| April 2023 | $449,000 |
| June 2023 | $477,575 |
| August 2023 | $474,500 |
| October 2023 | $450,000 |
| December 2023 | $439,900 |
| February 2024 | $434,123 |
| April 2024 | $435,000 |
| June 2024 | $440,000 |
| August 2024 | $435,000 |
| October 2024 | $427,450 |
| December 2024 | $421,000 |
| February 2025 | $424,944 |
| April 2025 | $441,974 |
| June 2025 | $449,900 |
| August 2025 | $445,000 |
| October 2025 | $438,500 |
| December 2025 | $425,000 |
| February 2026 | $422,125 |
| April 2026 | $429,950 |
| June 2026 | $429,450 |
| August 2026 | $415,000 |
Realtor.com via FRED · St. Louis Fed · Housing Inventory: Median Listing Price in Hillsborough County, FL
Asking price divided by interior area, at the county midpoint. It travels better between areas than a total price because it partly removes house size from the comparison — but it still ignores lot, age, finish level and view.
$231
USD per square foot
−4.5% vs. a year earlier
August 2026 · monthly series
Median listing price per square foot (county): from $210 in August 2021 to $231 in August 2026 — higher over the period. Low of $210 in August 2021 and high of $251 in August 2023. 61 real observations.
August 2021 — August 2026 · 61 observations
Realtor.com via FRED · St. Louis FedShowing 1 in every 2 real observations from the selected period.
| Period | Price per sq ft |
|---|---|
| August 2021 | $210 |
| October 2021 | $218 |
| December 2021 | $225 |
| February 2022 | $232 |
| April 2022 | $242 |
| June 2022 | $246 |
| August 2022 | $244 |
| October 2022 | $242 |
| December 2022 | $237 |
| February 2023 | $235 |
| April 2023 | $240 |
| June 2023 | $248 |
| August 2023 | $251 |
| October 2023 | $249 |
| December 2023 | $244 |
| February 2024 | $241 |
| April 2024 | $240 |
| June 2024 | $242 |
| August 2024 | $241 |
| October 2024 | $238 |
| December 2024 | $239 |
| February 2025 | $241 |
| April 2025 | $240 |
| June 2025 | $241 |
| August 2025 | $242 |
| October 2025 | $242 |
| December 2025 | $237 |
| February 2026 | $236 |
| April 2026 | $234 |
| June 2026 | $235 |
| August 2026 | $231 |
Realtor.com via FRED · St. Louis Fed · Housing Inventory: Median Listing Price per Square Feet in Hillsborough County, FL
How many homes were actively listed for sale in the county during the month: a snapshot of available supply. It says nothing about how many sold and excludes homes already under contract.
6,267
active listings
−4.6% vs. a year earlier
August 2026 · monthly series
Active listings (county): from 1,876 in August 2021 to 6,267 in August 2026 — higher over the period. Low of 1,043 in February 2022 and high of 6,751 in June 2025. 61 real observations.
August 2021 — August 2026 · 61 observations
Realtor.com via FRED · St. Louis FedShowing 1 in every 2 real observations from the selected period.
| Period | Active listings |
|---|---|
| August 2021 | 1,876 |
| October 2021 | 1,767 |
| December 2021 | 1,429 |
| February 2022 | 1,043 |
| April 2022 | 1,234 |
| June 2022 | 2,429 |
| August 2022 | 3,989 |
| October 2022 | 4,061 |
| December 2022 | 4,025 |
| February 2023 | 3,430 |
| April 2023 | 2,857 |
| June 2023 | 2,822 |
| August 2023 | 3,199 |
| October 2023 | 3,867 |
| December 2023 | 4,049 |
| February 2024 | 4,103 |
| April 2024 | 4,540 |
| June 2024 | 5,126 |
| August 2024 | 5,485 |
| October 2024 | 5,505 |
| December 2024 | 5,257 |
| February 2025 | 5,532 |
| April 2025 | 6,319 |
| June 2025 | 6,751 |
| August 2025 | 6,567 |
| October 2025 | 6,372 |
| December 2025 | 5,949 |
| February 2026 | 5,824 |
| April 2026 | 5,881 |
| June 2026 | 6,036 |
| August 2026 | 6,267 |
Realtor.com via FRED · St. Louis Fed · Housing Inventory: Active Listing Count in Hillsborough County, FL
Homes that entered the county market for the first time that month. It measures how much new supply arrived, which is what usually changes negotiating room from one season to the next.
1,956
new listings in the month
+3.6% vs. a year earlier
August 2026 · monthly series
New listings (county): from 2,588 in August 2021 to 1,956 in August 2026 — lower over the period. Low of 1,352 in December 2025 and high of 3,120 in June 2022. 61 real observations.
August 2021 — August 2026 · 61 observations
Realtor.com via FRED · St. Louis FedShowing 1 in every 2 real observations from the selected period.
| Period | New listings |
|---|---|
| August 2021 | 2,588 |
| October 2021 | 2,328 |
| December 2021 | 1,720 |
| February 2022 | 2,080 |
| April 2022 | 2,464 |
| June 2022 | 3,120 |
| August 2022 | 2,530 |
| October 2022 | 1,972 |
| December 2022 | 1,472 |
| February 2023 | 1,826 |
| April 2023 | 2,124 |
| June 2023 | 2,072 |
| August 2023 | 2,116 |
| October 2023 | 2,014 |
| December 2023 | 1,516 |
| February 2024 | 2,208 |
| April 2024 | 2,456 |
| June 2024 | 2,228 |
| August 2024 | 1,940 |
| October 2024 | 1,942 |
| December 2024 | 1,486 |
| February 2025 | 2,318 |
| April 2025 | 2,606 |
| June 2025 | 2,090 |
| August 2025 | 1,888 |
| October 2025 | 1,844 |
| December 2025 | 1,352 |
| February 2026 | 2,194 |
| April 2026 | 2,304 |
| June 2026 | 2,242 |
| August 2026 | 1,956 |
Realtor.com via FRED · St. Louis Fed · Housing Inventory: New Listing Count in Hillsborough County, FL
The midpoint of how long county listings stayed on the market that month: half were listed for less, half for more. It measures pace, not price.
67
days on market
−6.9% vs. a year earlier
August 2026 · monthly series
Median days on market (county): from 32 in August 2021 to 67 in August 2026 — higher over the period. Low of 23 in May 2022 and high of 84 in January 2026. 61 real observations.
August 2021 — August 2026 · 61 observations
Realtor.com via FRED · St. Louis FedShowing 1 in every 2 real observations from the selected period.
| Period | Days on market |
|---|---|
| August 2021 | 32 |
| October 2021 | 36 |
| December 2021 | 60 |
| February 2022 | 31 |
| April 2022 | 26 |
| June 2022 | 26 |
| August 2022 | 37 |
| October 2022 | 55 |
| December 2022 | 64 |
| February 2023 | 61 |
| April 2023 | 47 |
| June 2023 | 44 |
| August 2023 | 42 |
| October 2023 | 45 |
| December 2023 | 58 |
| February 2024 | 55 |
| April 2024 | 48 |
| June 2024 | 51 |
| August 2024 | 61 |
| October 2024 | 69 |
| December 2024 | 75 |
| February 2025 | 68 |
| April 2025 | 54 |
| June 2025 | 65 |
| August 2025 | 72 |
| October 2025 | 75 |
| December 2025 | 79 |
| February 2026 | 77 |
| April 2026 | 63 |
| June 2026 | 63 |
| August 2026 | 67 |
Realtor.com via FRED · St. Louis Fed · Housing Inventory: Median Days on Market in Hillsborough County, FL
Median listing price
$415,000
median asking price (USD)
−1.9% vs. a year earlier
August 2026 · monthly series
Florida house price index
825.7
index · base 1980:Q1 = 100
+1.4% vs. a year earlier
Q2 2026 · quarterly series
30-year fixed mortgage rate
6.71%
annual rate
+0.21 percentage points vs. a year earlier
Week ending Sep 03, 2026 · weekly average
Honest trade-offs
Trade-offs
Compare
A master-planned area in southeast Orlando organized around health, education, technology and an unusually connected network of trails and parks.
OpenA city west of Orlando with a genuine historic downtown, wrapped by newer residential communities built over the last two decades.
OpenA low-density, lake-oriented area on the Butler Chain of Lakes, known for large lots, mature oaks and privacy.
OpenNext step
Goals, budget, timing and the regions that fit you — with no obligation.