
Identity
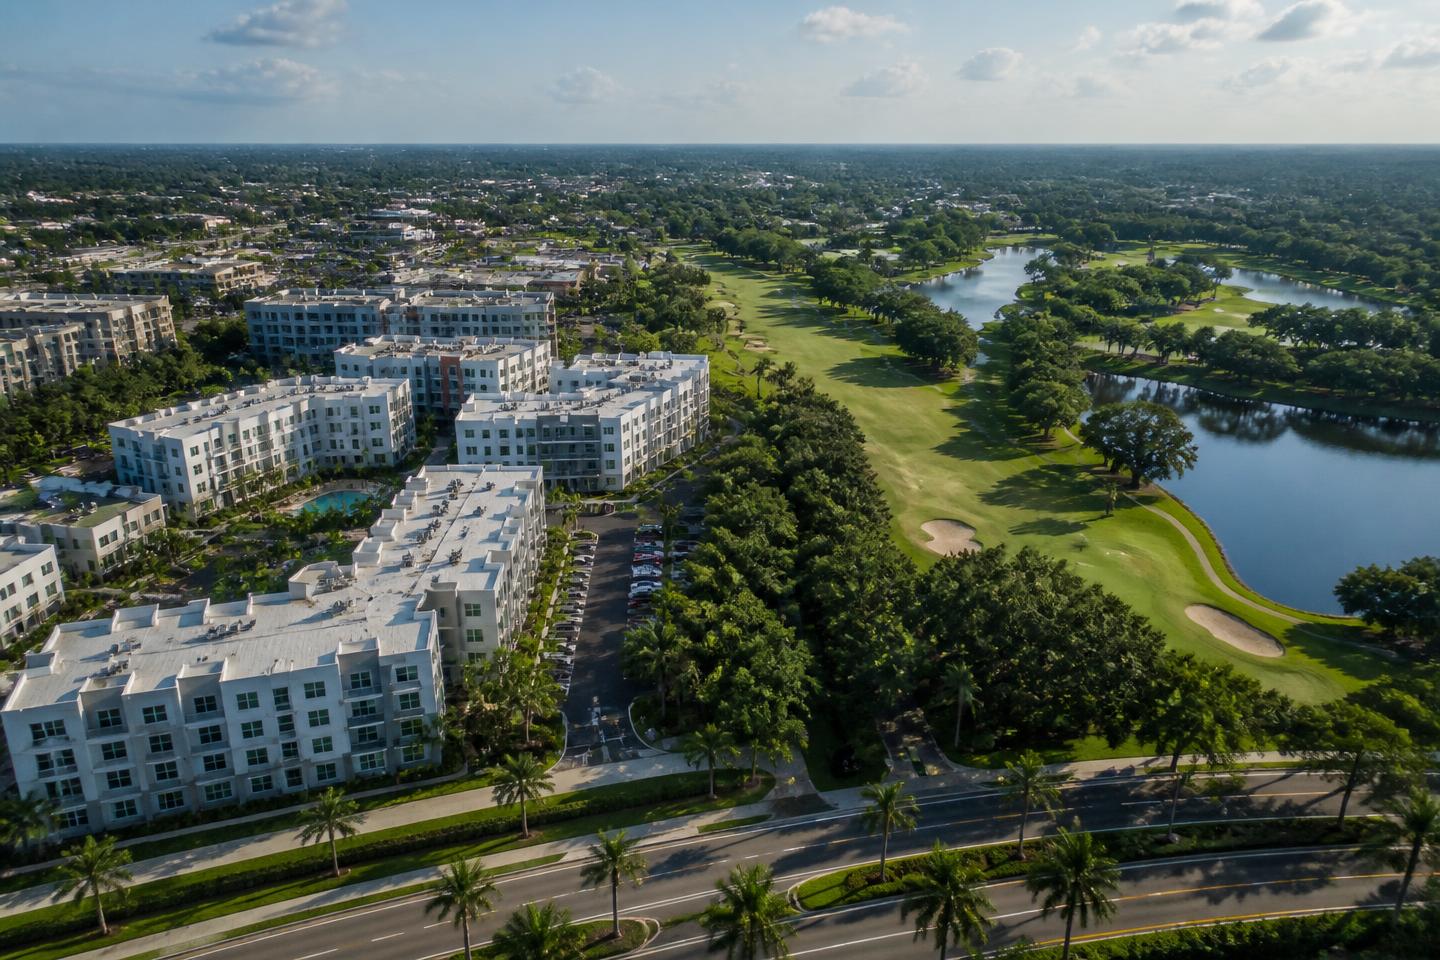
MetroWest was master-planned decades ago and has since filled in. The result is unusual for Orlando: a high proportion of attached housing and condominiums inside a single street network, with the golf course as its organising feature.
Orange County
Greater OrlandoCentral Florida
An established planned community west of downtown Orlando, built around a golf course and a dense mix of condominiums, apartments and houses.
Talk to DaniMetroWest was master-planned decades ago and has since filled in. The result is unusual for Orlando: a high proportion of attached housing and condominiums inside a single street network, with the golf course as its organising feature.
West Orlando, between Kirkman Road and S Hiawassee Road, close to Universal and to the I-4 corridor.
Everyday errands happen along the internal parkway; the tourist corridor and downtown are both short drives on well-known routes.
There is little vacant land left; new product arrives mostly as renovation or redevelopment of existing buildings.
Car-based, with quick access to I-4, SR-408 and the Turnpike through Kirkman and Conroy roads.
The area
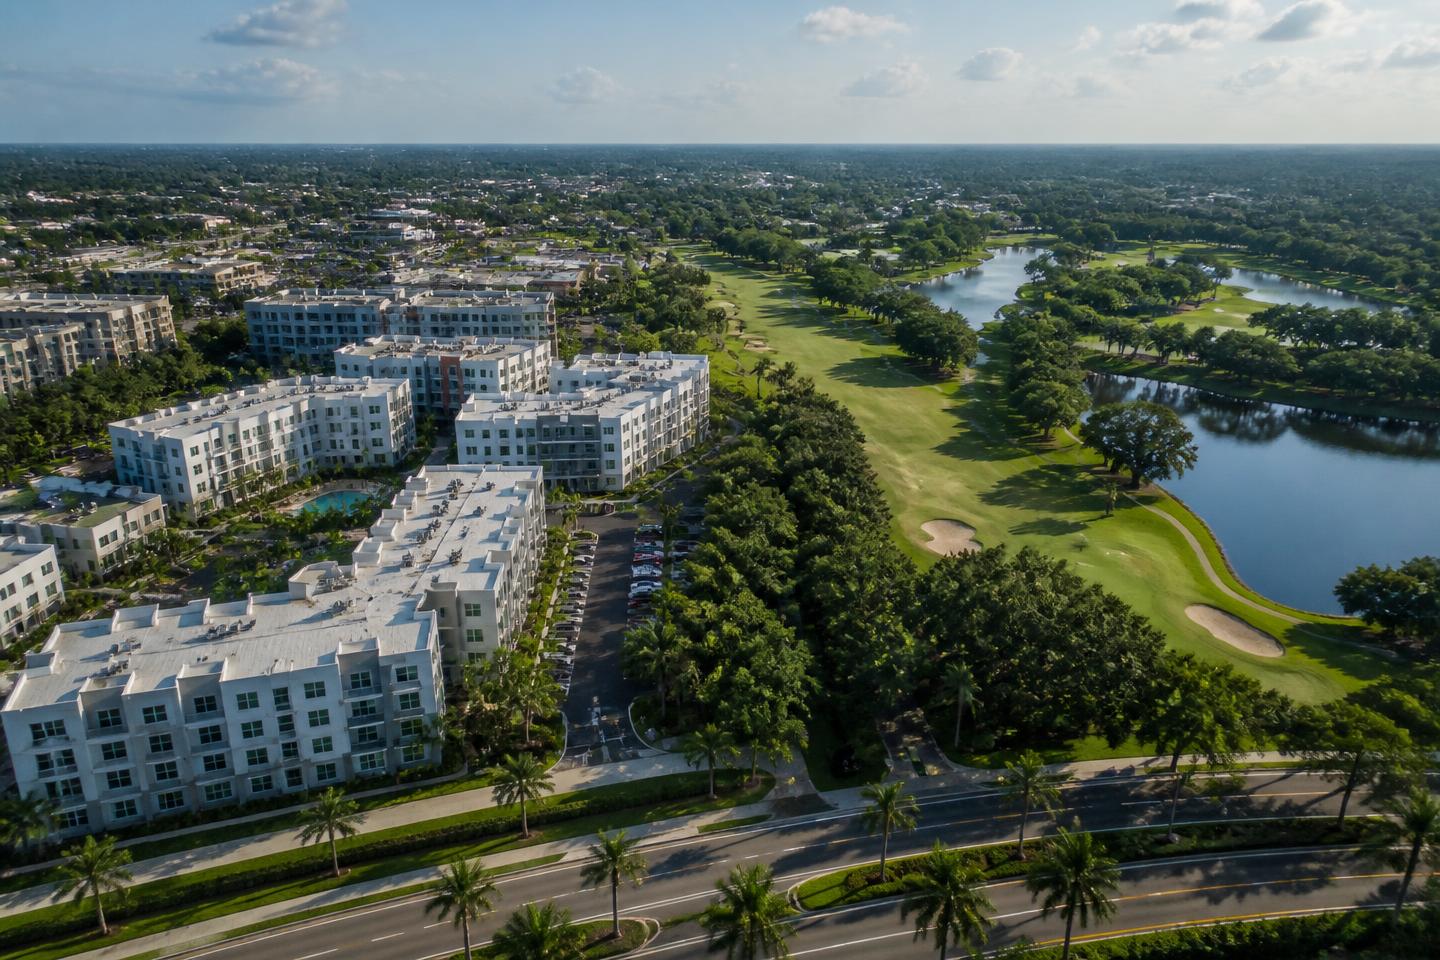
Golf-course guest gates and office towers just off the tourist corridor.
Real life here
The week runs along a single internal parkway that loops the golf course: quick trips to condo or apartment amenities, a short drive to Universal for work or entertainment, and Bill Frederick Park at Turkey Lake for a slower weekend afternoon.
Everyday eating out is chain-led along Kirkman Road and Conroy Road, with the far larger Universal CityWalk and International Drive dining scene only minutes away by car.
Supermarkets, pharmacies and clinics are along Kirkman and Conroy roads. Building-specific condo fees and reserve health matter as much here as location does.
Tourist-corridor traffic on I-4 and Kirkman Road thickens in the peak travel months, which is felt directly by anyone commuting toward Universal or International Drive.
Real indicators
These numbers are published per county, not per neighbourhood or community. They show the direction of the market around this area — they do not estimate the price of a specific home.
The midpoint asking price of homes listed across the whole county that month. It is what sellers ask, not what buyers pay, and a county is far larger than a single community — a specific neighbourhood can sit well above or below it.
$430,000
median asking price (USD)
−0.9% vs. a year earlier
August 2026 · monthly series
Median listing price (county): from $380,026 in August 2021 to $430,000 in August 2026 — higher over the period. Low of $380,026 in August 2021 and high of $497,300 in July 2023. 61 real observations.
August 2021 — August 2026 · 61 observations
Realtor.com via FRED · St. Louis FedShowing 1 in every 2 real observations from the selected period.
| Period | Median listing price |
|---|---|
| August 2021 | $380,026 |
| October 2021 | $393,715 |
| December 2021 | $385,495 |
| February 2022 | $395,475 |
| April 2022 | $429,900 |
| June 2022 | $485,000 |
| August 2022 | $477,000 |
| October 2022 | $456,495 |
| December 2022 | $440,000 |
| February 2023 | $437,475 |
| April 2023 | $464,000 |
| June 2023 | $495,000 |
| August 2023 | $487,500 |
| October 2023 | $474,999 |
| December 2023 | $445,000 |
| February 2024 | $439,248 |
| April 2024 | $445,875 |
| June 2024 | $455,000 |
| August 2024 | $454,900 |
| October 2024 | $439,950 |
| December 2024 | $425,473 |
| February 2025 | $422,450 |
| April 2025 | $430,000 |
| June 2025 | $445,000 |
| August 2025 | $433,990 |
| October 2025 | $429,950 |
| December 2025 | $428,625 |
| February 2026 | $427,000 |
| April 2026 | $435,000 |
| June 2026 | $443,995 |
| August 2026 | $430,000 |
Realtor.com via FRED · St. Louis Fed · Housing Inventory: Median Listing Price in Orange County, FL
Asking price divided by interior area, at the county midpoint. It travels better between areas than a total price because it partly removes house size from the comparison — but it still ignores lot, age, finish level and view.
$242
USD per square foot
−1.6% vs. a year earlier
August 2026 · monthly series
Median listing price per square foot (county): from $207 in August 2021 to $242 in August 2026 — higher over the period. Low of $207 in August 2021 and high of $257 in September 2023. 61 real observations.
August 2021 — August 2026 · 61 observations
Realtor.com via FRED · St. Louis FedShowing 1 in every 2 real observations from the selected period.
| Period | Price per sq ft |
|---|---|
| August 2021 | $207 |
| October 2021 | $209 |
| December 2021 | $215 |
| February 2022 | $225 |
| April 2022 | $244 |
| June 2022 | $250 |
| August 2022 | $248 |
| October 2022 | $245 |
| December 2022 | $241 |
| February 2023 | $244 |
| April 2023 | $250 |
| June 2023 | $255 |
| August 2023 | $255 |
| October 2023 | $257 |
| December 2023 | $254 |
| February 2024 | $253 |
| April 2024 | $254 |
| June 2024 | $256 |
| August 2024 | $254 |
| October 2024 | $251 |
| December 2024 | $249 |
| February 2025 | $246 |
| April 2025 | $249 |
| June 2025 | $248 |
| August 2025 | $246 |
| October 2025 | $246 |
| December 2025 | $243 |
| February 2026 | $243 |
| April 2026 | $243 |
| June 2026 | $245 |
| August 2026 | $242 |
Realtor.com via FRED · St. Louis Fed · Housing Inventory: Median Listing Price per Square Feet in Orange County, FL
How many homes were actively listed for sale in the county during the month: a snapshot of available supply. It says nothing about how many sold and excludes homes already under contract.
5,577
active listings
−2.7% vs. a year earlier
August 2026 · monthly series
Active listings (county): from 2,057 in August 2021 to 5,577 in August 2026 — higher over the period. Low of 1,141 in February 2022 and high of 5,836 in June 2025. 61 real observations.
August 2021 — August 2026 · 61 observations
Realtor.com via FRED · St. Louis FedShowing 1 in every 2 real observations from the selected period.
| Period | Active listings |
|---|---|
| August 2021 | 2,057 |
| October 2021 | 1,866 |
| December 2021 | 1,454 |
| February 2022 | 1,141 |
| April 2022 | 1,228 |
| June 2022 | 2,089 |
| August 2022 | 3,221 |
| October 2022 | 3,097 |
| December 2022 | 2,865 |
| February 2023 | 2,379 |
| April 2023 | 2,086 |
| June 2023 | 2,189 |
| August 2023 | 2,474 |
| October 2023 | 2,878 |
| December 2023 | 3,145 |
| February 2024 | 3,266 |
| April 2024 | 3,590 |
| June 2024 | 4,096 |
| August 2024 | 4,611 |
| October 2024 | 4,819 |
| December 2024 | 4,717 |
| February 2025 | 4,978 |
| April 2025 | 5,442 |
| June 2025 | 5,836 |
| August 2025 | 5,731 |
| October 2025 | 5,532 |
| December 2025 | 5,188 |
| February 2026 | 5,044 |
| April 2026 | 5,233 |
| June 2026 | 5,474 |
| August 2026 | 5,577 |
Realtor.com via FRED · St. Louis Fed · Housing Inventory: Active Listing Count in Orange County, FL
Homes that entered the county market for the first time that month. It measures how much new supply arrived, which is what usually changes negotiating room from one season to the next.
1,760
new listings in the month
+9.2% vs. a year earlier
August 2026 · monthly series
New listings (county): from 2,186 in August 2021 to 1,760 in August 2026 — lower over the period. Low of 1,140 in December 2022 and high of 2,440 in June 2022. 61 real observations.
August 2021 — August 2026 · 61 observations
Realtor.com via FRED · St. Louis FedShowing 1 in every 2 real observations from the selected period.
| Period | New listings |
|---|---|
| August 2021 | 2,186 |
| October 2021 | 1,836 |
| December 2021 | 1,544 |
| February 2022 | 1,864 |
| April 2022 | 1,996 |
| June 2022 | 2,440 |
| August 2022 | 2,008 |
| October 2022 | 1,492 |
| December 2022 | 1,140 |
| February 2023 | 1,524 |
| April 2023 | 1,584 |
| June 2023 | 1,740 |
| August 2023 | 1,634 |
| October 2023 | 1,526 |
| December 2023 | 1,376 |
| February 2024 | 1,770 |
| April 2024 | 1,958 |
| June 2024 | 1,936 |
| August 2024 | 1,768 |
| October 2024 | 1,724 |
| December 2024 | 1,250 |
| February 2025 | 2,060 |
| April 2025 | 2,106 |
| June 2025 | 2,046 |
| August 2025 | 1,612 |
| October 2025 | 1,608 |
| December 2025 | 1,178 |
| February 2026 | 1,844 |
| April 2026 | 1,954 |
| June 2026 | 2,004 |
| August 2026 | 1,760 |
Realtor.com via FRED · St. Louis Fed · Housing Inventory: New Listing Count in Orange County, FL
The midpoint of how long county listings stayed on the market that month: half were listed for less, half for more. It measures pace, not price.
71
days on market
−1.4% vs. a year earlier
August 2026 · monthly series
Median days on market (county): from 36 in August 2021 to 71 in August 2026 — higher over the period. Low of 27 in June 2022 and high of 86 in January 2026. 61 real observations.
August 2021 — August 2026 · 61 observations
Realtor.com via FRED · St. Louis FedShowing 1 in every 2 real observations from the selected period.
| Period | Days on market |
|---|---|
| August 2021 | 36 |
| October 2021 | 41 |
| December 2021 | 56 |
| February 2022 | 32 |
| April 2022 | 31 |
| June 2022 | 27 |
| August 2022 | 39 |
| October 2022 | 57 |
| December 2022 | 66 |
| February 2023 | 58 |
| April 2023 | 47 |
| June 2023 | 41 |
| August 2023 | 43 |
| October 2023 | 45 |
| December 2023 | 54 |
| February 2024 | 53 |
| April 2024 | 47 |
| June 2024 | 51 |
| August 2024 | 58 |
| October 2024 | 66 |
| December 2024 | 77 |
| February 2025 | 68 |
| April 2025 | 58 |
| June 2025 | 65 |
| August 2025 | 72 |
| October 2025 | 78 |
| December 2025 | 80 |
| February 2026 | 78 |
| April 2026 | 64 |
| June 2026 | 66 |
| August 2026 | 71 |
Realtor.com via FRED · St. Louis Fed · Housing Inventory: Median Days on Market in Orange County, FL
Median listing price
$415,000
median asking price (USD)
−1.9% vs. a year earlier
August 2026 · monthly series
Florida house price index
825.7
index · base 1980:Q1 = 100
+1.4% vs. a year earlier
Q2 2026 · quarterly series
30-year fixed mortgage rate
6.71%
annual rate
+0.21 percentage points vs. a year earlier
Week ending Sep 03, 2026 · weekly average
Honest trade-offs
Trade-offs
Compare
A master-planned area in southeast Orlando organized around health, education, technology and an unusually connected network of trails and parks.
OpenA city west of Orlando with a genuine historic downtown, wrapped by newer residential communities built over the last two decades.
OpenA low-density, lake-oriented area on the Butler Chain of Lakes, known for large lots, mature oaks and privacy.
OpenNext step
Goals, budget, timing and the regions that fit you — with no obligation.