
Dani Kubrusly

Orange County

Hunter's Creek

Greater OrlandoCentral Florida

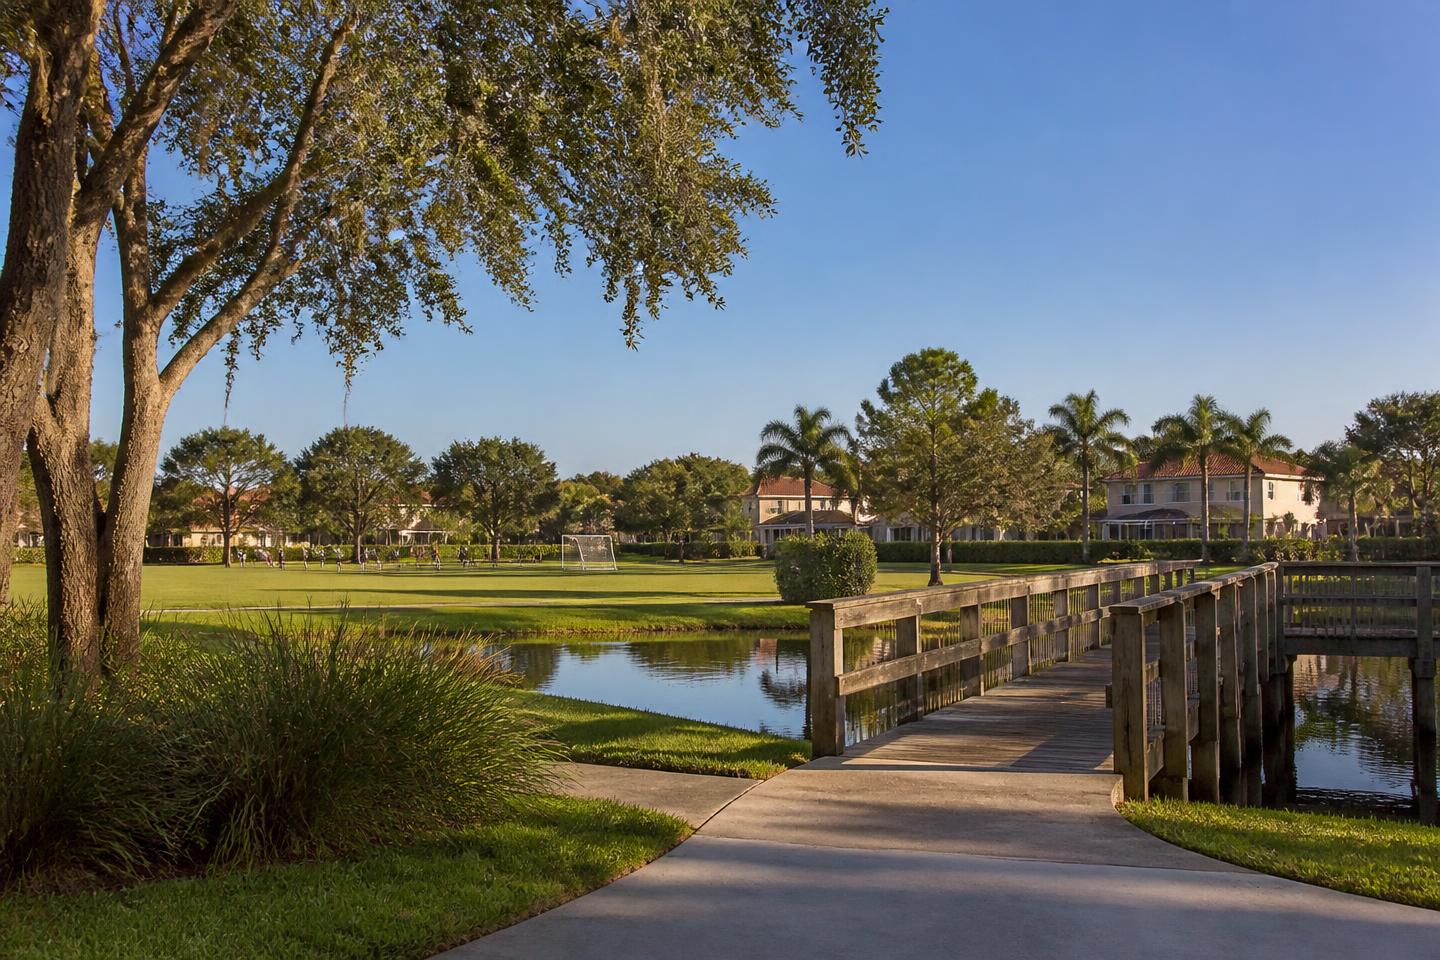
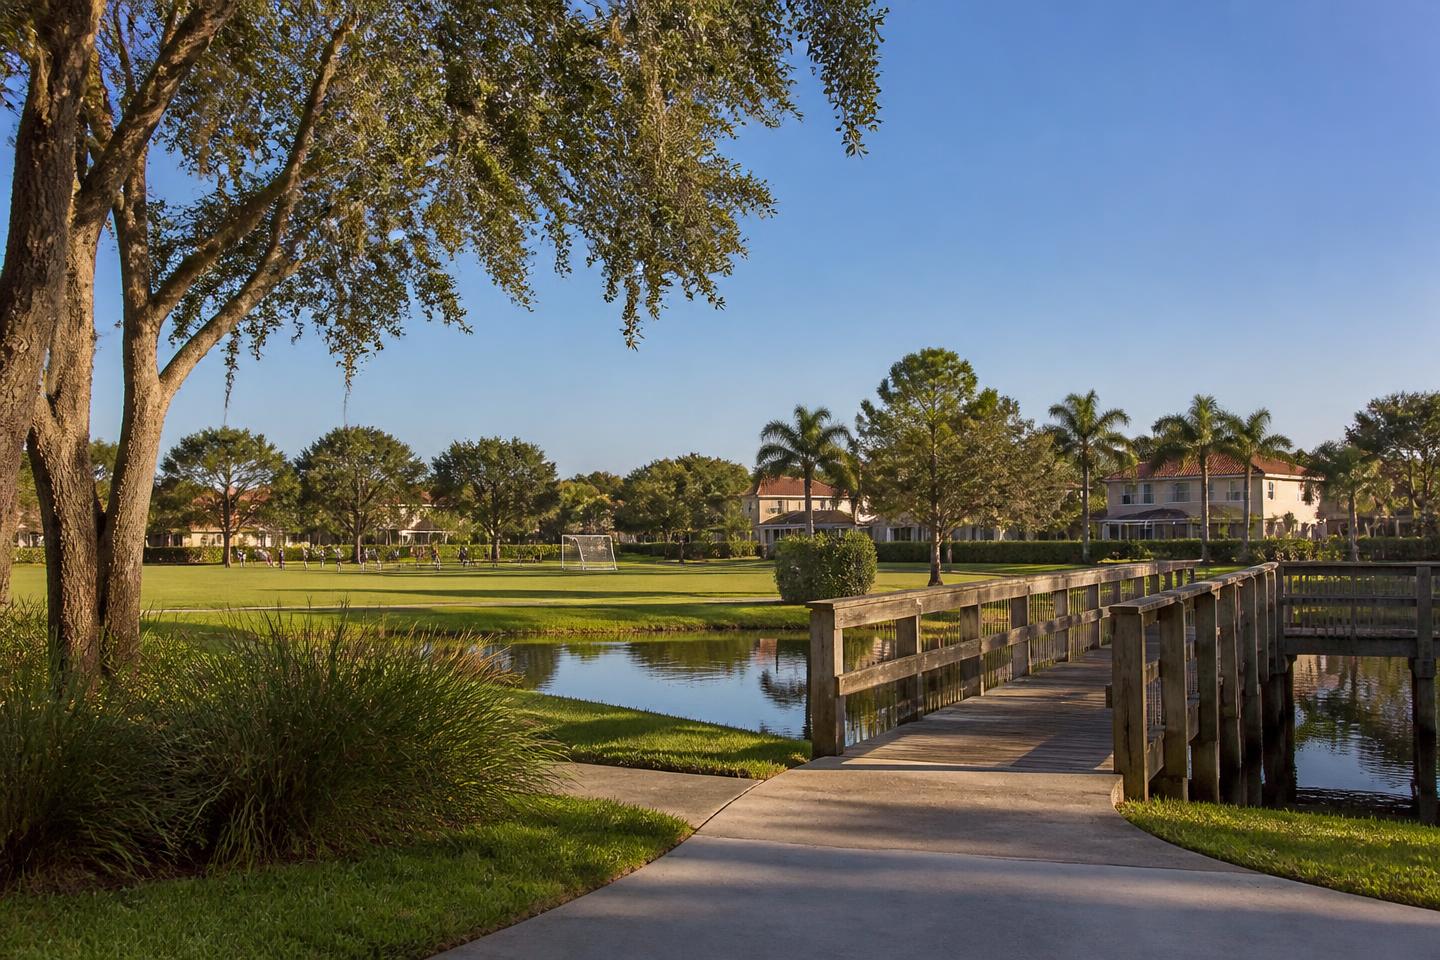
A mature master-planned community in south Orlando, organised around parks, sports fields and a set of neighbourhood commercial centres.

Talk to Dani

Identity

Built out over the 1990s and 2000s, Hunter's Creek has the advantage that newer areas lack: finished streets, grown trees and completed amenities. The plan reserved a large amount of land for parks and recreation, and that structure is still what defines it.
Location and access

South Orlando near John Young Parkway and SR-417, between the airport side of the metro and the theme-park corridor.

Everyday life

Weekday routines are short and local: schools, the parks system, community centre and everyday retail inside the same area.

  • The Hunter's Creek parks and recreation network.
  • Neighbourhood shopping centres along the main parkways.
  • Orlando International Airport and the theme parks, both a normal drive away.

Housing

  • Single-family homes from several 1990s–2000s phases.
  • Townhomes and condominiums near the commercial edges.
  • A community association with area-wide standards on top of local HOAs.

New construction

The community is essentially built out. New homes here mean renovation, not new phases.

Getting around

Car-based, with SR-417 and John Young Parkway handling most regional trips.

Hunter's Creek, Central Florida

The area

Curving lakes and greenbelts laid out south of the tourist corridor.

Real life here

What an ordinary week looks like.

An established, self-contained week: school, one of the neighbourhood commercial centres, and the parks and recreation network that the original plan set aside in generous amounts. Trips outside the area use SR-417 for the airport or points north and south.

Routines that fit

  • Wanting a finished, mature community rather than an active construction site.
  • Flying often, given the short drive to Orlando International Airport.
  • Using organised sports fields and recreation centres as part of the weekly routine.

Outdoors and leisure

  • The Hunter's Creek parks and recreation network, spread across the community's phases.
  • Community pools and sports fields tied to the homeowners' association.
  • Shaded walking loops on streets planted decades ago.

Eating and shopping

Neighbourhood shopping centres along the main parkways cover everyday chain restaurants and casual food; a wider selection is a short drive toward the Dr. Phillips or airport-area corridors.

Groceries, pharmacies and everyday clinics sit inside the community's commercial centres, with hospitals reached via John Young Parkway or SR-417.

Seasons

Airport and theme-park traffic on SR-417 and John Young Parkway is heavier during peak travel periods, though the interior of the community stays quiet year-round.

Real indicators

Market in Orange County, with sources.

These numbers are published per county, not per neighbourhood or community. They show the direction of the market around this area — they do not estimate the price of a specific home.

Median listing price (county)

The midpoint asking price of homes listed across the whole county that month. It is what sellers ask, not what buyers pay, and a county is far larger than a single community — a specific neighbourhood can sit well above or below it.

$430,000

median asking price (USD)

−0.9% vs. a year earlier

August 2026 · monthly series

Median listing price (county) · Orange County, FL

Median listing price (county): from $380,026 in August 2021 to $430,000 in August 2026 — higher over the period. Low of $380,026 in August 2021 and high of $497,300 in July 2023. 61 real observations.

August 2021August 2026 · 61 observations

Realtor.com via FRED · St. Louis Fed
View data table

Showing 1 in every 2 real observations from the selected period.

Median listing price (county)
PeriodMedian listing price
August 2021$380,026
October 2021$393,715
December 2021$385,495
February 2022$395,475
April 2022$429,900
June 2022$485,000
August 2022$477,000
October 2022$456,495
December 2022$440,000
February 2023$437,475
April 2023$464,000
June 2023$495,000
August 2023$487,500
October 2023$474,999
December 2023$445,000
February 2024$439,248
April 2024$445,875
June 2024$455,000
August 2024$454,900
October 2024$439,950
December 2024$425,473
February 2025$422,450
April 2025$430,000
June 2025$445,000
August 2025$433,990
October 2025$429,950
December 2025$428,625
February 2026$427,000
April 2026$435,000
June 2026$443,995
August 2026$430,000

Realtor.com via FRED · St. Louis Fed · Housing Inventory: Median Listing Price in Orange County, FL

Median listing price per square foot (county)

Asking price divided by interior area, at the county midpoint. It travels better between areas than a total price because it partly removes house size from the comparison — but it still ignores lot, age, finish level and view.

$242

USD per square foot

−1.6% vs. a year earlier

August 2026 · monthly series

Median listing price per square foot (county) · Orange County, FL

Median listing price per square foot (county): from $207 in August 2021 to $242 in August 2026 — higher over the period. Low of $207 in August 2021 and high of $257 in September 2023. 61 real observations.

August 2021August 2026 · 61 observations

Realtor.com via FRED · St. Louis Fed
View data table

Showing 1 in every 2 real observations from the selected period.

Median listing price per square foot (county)
PeriodPrice per sq ft
August 2021$207
October 2021$209
December 2021$215
February 2022$225
April 2022$244
June 2022$250
August 2022$248
October 2022$245
December 2022$241
February 2023$244
April 2023$250
June 2023$255
August 2023$255
October 2023$257
December 2023$254
February 2024$253
April 2024$254
June 2024$256
August 2024$254
October 2024$251
December 2024$249
February 2025$246
April 2025$249
June 2025$248
August 2025$246
October 2025$246
December 2025$243
February 2026$243
April 2026$243
June 2026$245
August 2026$242

Realtor.com via FRED · St. Louis Fed · Housing Inventory: Median Listing Price per Square Feet in Orange County, FL

Active listings (county)

How many homes were actively listed for sale in the county during the month: a snapshot of available supply. It says nothing about how many sold and excludes homes already under contract.

5,577

active listings

−2.7% vs. a year earlier

August 2026 · monthly series

Active listings (county) · Orange County, FL

Active listings (county): from 2,057 in August 2021 to 5,577 in August 2026 — higher over the period. Low of 1,141 in February 2022 and high of 5,836 in June 2025. 61 real observations.

August 2021August 2026 · 61 observations

Realtor.com via FRED · St. Louis Fed
View data table

Showing 1 in every 2 real observations from the selected period.

Active listings (county)
PeriodActive listings
August 20212,057
October 20211,866
December 20211,454
February 20221,141
April 20221,228
June 20222,089
August 20223,221
October 20223,097
December 20222,865
February 20232,379
April 20232,086
June 20232,189
August 20232,474
October 20232,878
December 20233,145
February 20243,266
April 20243,590
June 20244,096
August 20244,611
October 20244,819
December 20244,717
February 20254,978
April 20255,442
June 20255,836
August 20255,731
October 20255,532
December 20255,188
February 20265,044
April 20265,233
June 20265,474
August 20265,577

Realtor.com via FRED · St. Louis Fed · Housing Inventory: Active Listing Count in Orange County, FL

New listings (county)

Homes that entered the county market for the first time that month. It measures how much new supply arrived, which is what usually changes negotiating room from one season to the next.

1,760

new listings in the month

+9.2% vs. a year earlier

August 2026 · monthly series

New listings (county) · Orange County, FL

New listings (county): from 2,186 in August 2021 to 1,760 in August 2026 — lower over the period. Low of 1,140 in December 2022 and high of 2,440 in June 2022. 61 real observations.

August 2021August 2026 · 61 observations

Realtor.com via FRED · St. Louis Fed
View data table

Showing 1 in every 2 real observations from the selected period.

New listings (county)
PeriodNew listings
August 20212,186
October 20211,836
December 20211,544
February 20221,864
April 20221,996
June 20222,440
August 20222,008
October 20221,492
December 20221,140
February 20231,524
April 20231,584
June 20231,740
August 20231,634
October 20231,526
December 20231,376
February 20241,770
April 20241,958
June 20241,936
August 20241,768
October 20241,724
December 20241,250
February 20252,060
April 20252,106
June 20252,046
August 20251,612
October 20251,608
December 20251,178
February 20261,844
April 20261,954
June 20262,004
August 20261,760

Realtor.com via FRED · St. Louis Fed · Housing Inventory: New Listing Count in Orange County, FL

Median days on market (county)

The midpoint of how long county listings stayed on the market that month: half were listed for less, half for more. It measures pace, not price.

71

days on market

−1.4% vs. a year earlier

August 2026 · monthly series

Median days on market (county) · Orange County, FL

Median days on market (county): from 36 in August 2021 to 71 in August 2026 — higher over the period. Low of 27 in June 2022 and high of 86 in January 2026. 61 real observations.

August 2021August 2026 · 61 observations

Realtor.com via FRED · St. Louis Fed
View data table

Showing 1 in every 2 real observations from the selected period.

Median days on market (county)
PeriodDays on market
August 202136
October 202141
December 202156
February 202232
April 202231
June 202227
August 202239
October 202257
December 202266
February 202358
April 202347
June 202341
August 202343
October 202345
December 202354
February 202453
April 202447
June 202451
August 202458
October 202466
December 202477
February 202568
April 202558
June 202565
August 202572
October 202578
December 202580
February 202678
April 202664
June 202666
August 202671

Realtor.com via FRED · St. Louis Fed · Housing Inventory: Median Days on Market in Orange County, FL

Metro and statewide context

Median listing price

$415,000

median asking price (USD)

−1.9% vs. a year earlier

August 2026 · monthly series

Florida house price index

825.7

index · base 1980:Q1 = 100

+1.4% vs. a year earlier

Q2 2026 · quarterly series

30-year fixed mortgage rate

6.71%

annual rate

+0.21 percentage points vs. a year earlier

Week ending Sep 03, 2026 · weekly average

Honest trade-offs

What you accept when you choose this area.

Trade-offs

  • Homes are 20–30 years old: roofs, HVAC and plumbing deserve inspection.
  • Two association layers can mean two sets of rules and fees.
  • Proximity to major corridors brings traffic at peak hours.

Next step

A thirty-minute conversation.

Goals, budget, timing and the regions that fit you — with no obligation.

Talk to Dani