
Dani Kubrusly

Osceola / Polk / Lake

Four Corners

Greater OrlandoCentral Florida

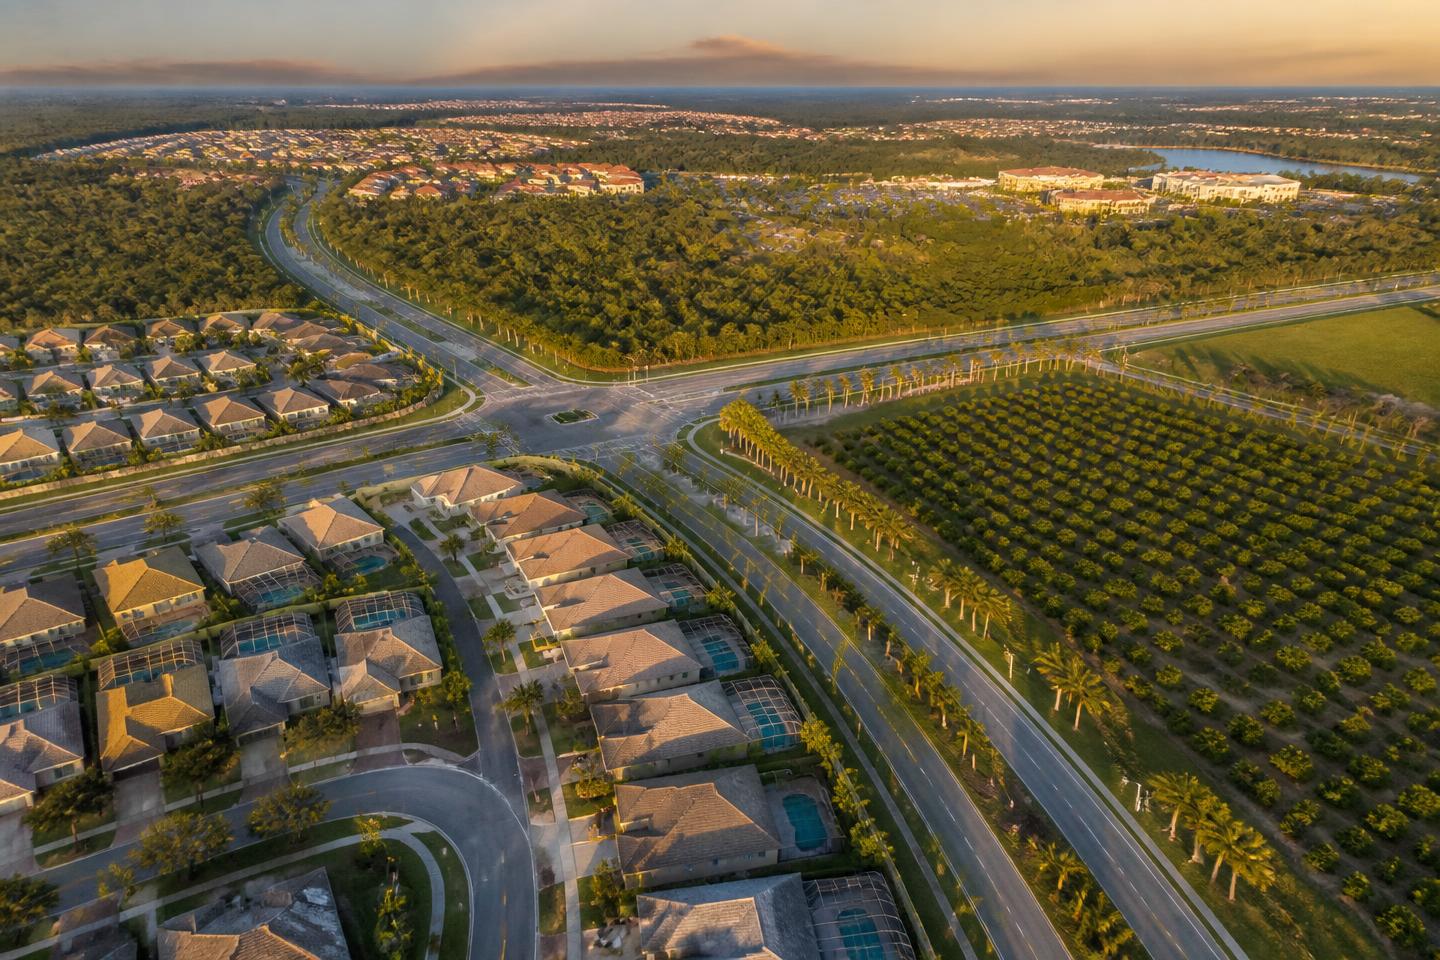
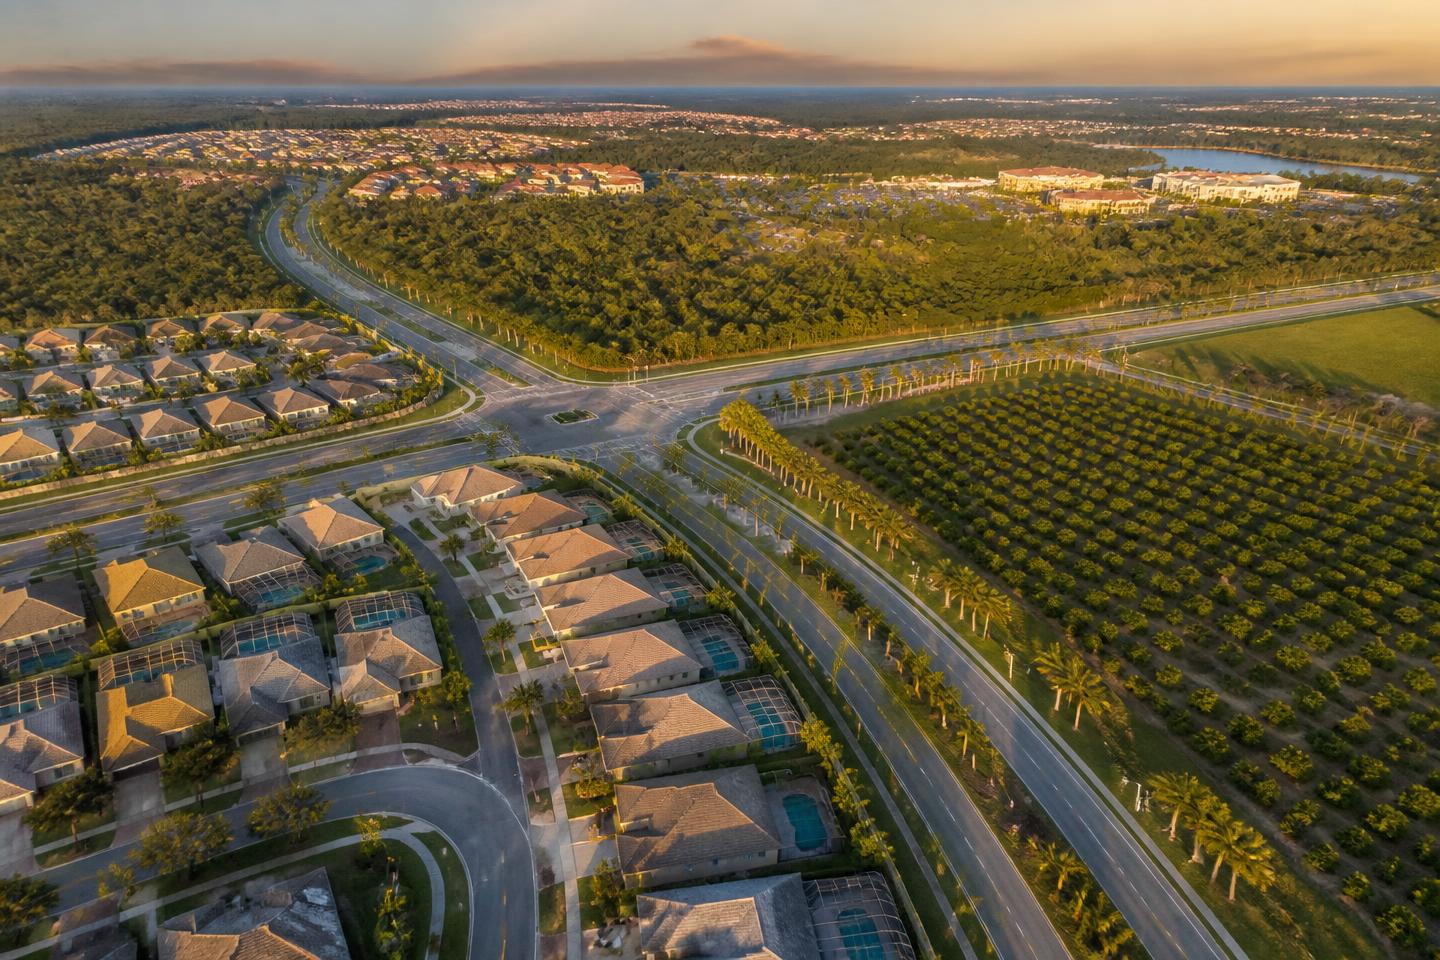
The area where four counties meet southwest of Orlando, dominated by resort-style communities and short-term rental product near the theme parks.

Talk to Dani

Identity

Four Corners is less a city than a market: an unincorporated area along US-192 and Highway 27 where a large share of the housing was built to be rented by the week. County lines run through it, and rules can change from one side of a road to the other.
Location and access

Southwest of the theme-park corridor, at the meeting point of Osceola, Polk, Lake and Orange counties.

Everyday life

The rhythm follows tourism: busy holiday weeks, quieter shoulder seasons, and a service economy along the main highways.

  • The theme-park corridor along US-192.
  • Resort communities with clubhouses and water features.
  • Retail and dining concentrated on Highway 27.

Housing

  • Vacation homes and townhomes in short-term-rental communities.
  • Standard residential subdivisions with annual-rental or owner-occupied rules.
  • Condo-hotel and condominium product near the corridor.

New construction

Construction continues along both highways, in resort and conventional formats. Whether a specific address may be rented nightly depends on county and HOA rules and must be confirmed before purchase.

Getting around

Highway-based: US-192, Highway 27 and I-4 carry nearly everything.

Four Corners, Central Florida

The area

Vacation-home neighborhoods spread across the meeting point of four counties.

Real life here

What an ordinary week looks like.

This is a resort corridor more than a town: the week follows tourism rather than a single downtown, with busy holiday weeks, quieter shoulder seasons, and a service economy running along US-192 and Highway 27. Streets inside the gated communities are HOA-managed, and life inside them centres on clubhouses and pools rather than a walkable centre.

Routines that fit

  • Owning a vacation home in a resort-style community close to the theme parks.
  • Wanting newer construction with pools, golf and clubhouses bundled into the HOA.
  • Accepting a fully car-based routine along US-192, Highway 27 and I-4.
  • Confirming which county — Osceola, Polk or Lake — and which HOA rules apply before assuming nightly rental is allowed.

Outdoors and leisure

  • Golf courses along the Highway 27 corridor.
  • Resort pools, water features and clubhouses inside the larger communities.
  • Lake Eva Community Park in nearby Haines City.
  • Northeast Regional Park, with fields, courts and trails.

Eating and shopping

Everyday dining is chain-led along US-192 and Highway 27; the ChampionsGate and Posner Park retail nodes add a wider mix a short drive away.

Supermarkets, pharmacies and urgent care are spread along the two highways; hospitals are reached in Haines City, Celebration or the Kissimmee corridor depending on which side of the corridor an address sits.

Seasons

Occupancy and traffic follow the theme-park calendar closely, and construction continues across the corridor, so the surroundings of any given address should be expected to keep changing.

Real indicators

Market in Osceola County, with sources.

These numbers are published per county, not per neighbourhood or community. They show the direction of the market around this area — they do not estimate the price of a specific home.

Median listing price (county)

The midpoint asking price of homes listed across the whole county that month. It is what sellers ask, not what buyers pay, and a county is far larger than a single community — a specific neighbourhood can sit well above or below it.

$410,000

median asking price (USD)

−4.3% vs. a year earlier

August 2026 · monthly series

Median listing price (county) · Osceola County, FL

Median listing price (county): from $371,689 in August 2021 to $410,000 in August 2026 — higher over the period. Low of $371,689 in August 2021 and high of $470,033 in June 2023. 61 real observations.

August 2021August 2026 · 61 observations

Realtor.com via FRED · St. Louis Fed
View data table

Showing 1 in every 2 real observations from the selected period.

Median listing price (county)
PeriodMedian listing price
August 2021$371,689
October 2021$399,999
December 2021$404,856
February 2022$424,698
April 2022$449,900
June 2022$455,495
August 2022$459,972
October 2022$449,995
December 2022$449,999
February 2023$451,886
April 2023$459,000
June 2023$470,033
August 2023$469,950
October 2023$466,250
December 2023$459,500
February 2024$453,933
April 2024$452,450
June 2024$445,000
August 2024$435,000
October 2024$429,500
December 2024$429,900
February 2025$427,445
April 2025$432,250
June 2025$430,000
August 2025$428,400
October 2025$425,000
December 2025$420,000
February 2026$419,950
April 2026$417,450
June 2026$415,000
August 2026$410,000

Realtor.com via FRED · St. Louis Fed · Housing Inventory: Median Listing Price in Osceola County, FL

Median listing price per square foot (county)

Asking price divided by interior area, at the county midpoint. It travels better between areas than a total price because it partly removes house size from the comparison — but it still ignores lot, age, finish level and view.

$208

USD per square foot

−4.1% vs. a year earlier

August 2026 · monthly series

Median listing price per square foot (county) · Osceola County, FL

Median listing price per square foot (county): from $188 in August 2021 to $208 in August 2026 — higher over the period. Low of $188 in August 2021 and high of $237 in May 2022. 61 real observations.

August 2021August 2026 · 61 observations

Realtor.com via FRED · St. Louis Fed
View data table

Showing 1 in every 2 real observations from the selected period.

Median listing price per square foot (county)
PeriodPrice per sq ft
August 2021$188
October 2021$195
December 2021$203
February 2022$213
April 2022$231
June 2022$236
August 2022$234
October 2022$233
December 2022$229
February 2023$229
April 2023$229
June 2023$233
August 2023$234
October 2023$233
December 2023$233
February 2024$232
April 2024$230
June 2024$230
August 2024$228
October 2024$226
December 2024$224
February 2025$224
April 2025$221
June 2025$219
August 2025$217
October 2025$217
December 2025$215
February 2026$213
April 2026$212
June 2026$210
August 2026$208

Realtor.com via FRED · St. Louis Fed · Housing Inventory: Median Listing Price per Square Feet in Osceola County, FL

Active listings (county)

How many homes were actively listed for sale in the county during the month: a snapshot of available supply. It says nothing about how many sold and excludes homes already under contract.

4,135

active listings

−3.4% vs. a year earlier

August 2026 · monthly series

Active listings (county) · Osceola County, FL

Active listings (county): from 816 in August 2021 to 4,135 in August 2026 — higher over the period. Low of 545 in March 2022 and high of 4,349 in June 2025. 61 real observations.

August 2021August 2026 · 61 observations

Realtor.com via FRED · St. Louis Fed
View data table

Showing 1 in every 2 real observations from the selected period.

Active listings (county)
PeriodActive listings
August 2021816
October 2021933
December 2021805
February 2022556
April 2022643
June 20221,305
August 20221,992
October 20222,158
December 20222,216
February 20232,130
April 20231,938
June 20232,051
August 20232,316
October 20232,714
December 20232,954
February 20243,070
April 20243,244
June 20243,582
August 20243,801
October 20243,873
December 20243,847
February 20254,036
April 20254,285
June 20254,349
August 20254,282
October 20254,215
December 20254,140
February 20263,947
April 20264,072
June 20264,176
August 20264,135

Realtor.com via FRED · St. Louis Fed · Housing Inventory: Active Listing Count in Osceola County, FL

New listings (county)

Homes that entered the county market for the first time that month. It measures how much new supply arrived, which is what usually changes negotiating room from one season to the next.

940

new listings in the month

−3.3% vs. a year earlier

August 2026 · monthly series

New listings (county) · Osceola County, FL

New listings (county): from 1,052 in August 2021 to 940 in August 2026 — lower over the period. Low of 608 in December 2022 and high of 1,324 in May 2022. 61 real observations.

August 2021August 2026 · 61 observations

Realtor.com via FRED · St. Louis Fed
View data table

Showing 1 in every 2 real observations from the selected period.

New listings (county)
PeriodNew listings
August 20211,052
October 2021964
December 2021904
February 2022978
April 20221,084
June 20221,310
August 2022978
October 2022920
December 2022608
February 2023908
April 2023868
June 2023920
August 2023996
October 2023866
December 2023792
February 20241,076
April 20241,152
June 20241,100
August 20241,020
October 20241,046
December 2024782
February 20251,142
April 20251,170
June 2025982
August 2025972
October 2025984
December 2025730
February 20261,010
April 20261,030
June 2026998
August 2026940

Realtor.com via FRED · St. Louis Fed · Housing Inventory: New Listing Count in Osceola County, FL

Median days on market (county)

The midpoint of how long county listings stayed on the market that month: half were listed for less, half for more. It measures pace, not price.

89

days on market

−3.3% vs. a year earlier

August 2026 · monthly series

Median days on market (county) · Osceola County, FL

Median days on market (county): from 37 in August 2021 to 89 in August 2026 — higher over the period. Low of 26 in May 2022 and high of 100 in January 2026. 61 real observations.

August 2021August 2026 · 61 observations

Realtor.com via FRED · St. Louis Fed
View data table

Showing 1 in every 2 real observations from the selected period.

Median days on market (county)
PeriodDays on market
August 202137
October 202141
December 202162
February 202234
April 202229
June 202230
August 202243
October 202260
December 202274
February 202372
April 202364
June 202358
August 202356
October 202360
December 202373
February 202480
April 202471
June 202467
August 202474
October 202482
December 202489
February 202585
April 202573
June 202585
August 202592
October 202592
December 202594
February 202696
April 202681
June 202683
August 202689

Realtor.com via FRED · St. Louis Fed · Housing Inventory: Median Days on Market in Osceola County, FL

Metro and statewide context

Median listing price

$415,000

median asking price (USD)

−1.9% vs. a year earlier

August 2026 · monthly series

Florida house price index

825.7

index · base 1980:Q1 = 100

+1.4% vs. a year earlier

Q2 2026 · quarterly series

30-year fixed mortgage rate

6.71%

annual rate

+0.21 percentage points vs. a year earlier

Week ending Sep 03, 2026 · weekly average

Honest trade-offs

What you accept when you choose this area.

Trade-offs

  • Zoning for nightly rental is address-specific, never area-wide.
  • Resort communities carry higher fees for the amenities they operate.
  • Tourism seasonality shapes both traffic and occupancy.

Next step

A thirty-minute conversation.

Goals, budget, timing and the regions that fit you — with no obligation.

Talk to Dani